This is a technical bulletin from Revelwood’s Steve Ellis.
Did you know that the latest version of Microsoft Office 365 caused Planning Analytics for Microsoft Excel (PAx) to become unusable? I will show you how to determine if you have been impacted and how to resolve this.
Root Cause: This is not an issue with PAx. This incompatibility was caused by the latest Microsoft Office update in May 2018. IBM has logged the issue with Microsoft, and although Microsoft is working on a fix, there is not a resolution date at this time.
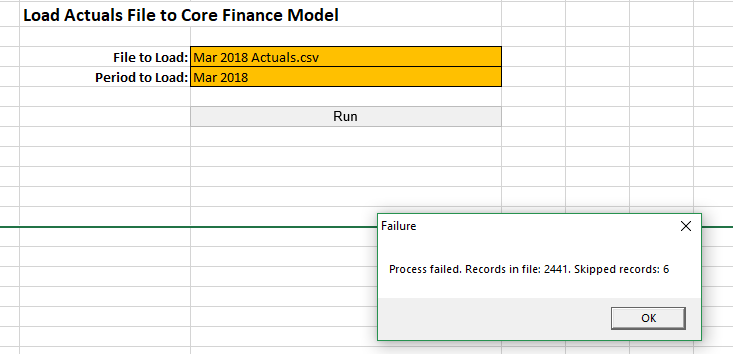
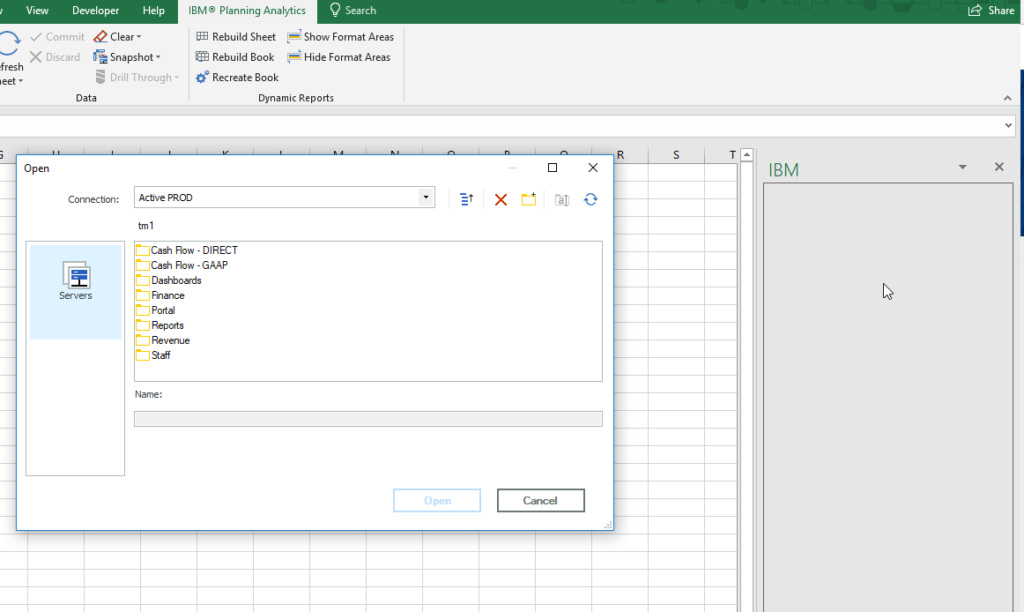
Symptoms: After connecting, your Task Pane will appear completely grey. You will not be able to navigate the Task Pane in any way. Please see the image below that illustrates the issue:
Resolution: You will need to revert your version of Microsoft Office 365 to the latest stable copy. To do so, please follow the below directions:
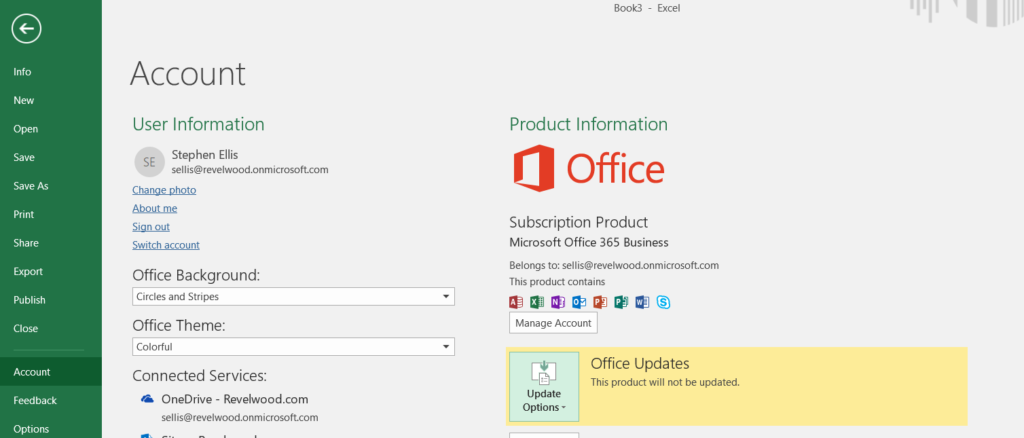
- Turn off Automatic Excel Updates (File > Options > Update Options > Click “Disable Updates”)
- Open the Command Prompt as Administrator
- Paste this into the Command Prompt and then hit Enter: cd %programfiles%\Common Files\Microsoft Shared\ClickToRun
- Paste this into command prompt and then Enter: exe /update user updatetoversion=16.0.9029.2253
The above actions will revert your Microsoft Office 365 to the last stable version, and PAx will now work as intended.
Need help resolving this issue? Revelwood is standing by and ready to assist you! Please contact us at info@revelwood.com.