This post continues our series on how we use Workday Adaptive Planning to solve problems. Each blog post focuses on a real-world client experience where Revelwood was presented with a unique or thorny problem. We’ll explain our approach to how we solved it.
Revelwood Client: A construction company that prides itself on building homes that “just feel right.” They build quality-made homes across Easter Pennsylvania, in Berks County, Chester County, Lancaster County, Lebanon County and more.
Problem: Managing Cash Flow
Scenario: Cash flow is one of the biggest challenges facing home builders. A home building company will get a down payment from a client, after which the construction company relies on bank loans per project to cover the labor and material costs until the home is finished and turned over to the new homeowner. It sounds simple – except when faced with variable costs for labor and goods, delays for materials and a multitude of new projects at various levels of completion. This company needed insight into how the increasing costs and delays impact any one project. They also wanted to understand how the sum of the current projects relate to cash flow and the company’s ability to sign contracts with new clients.
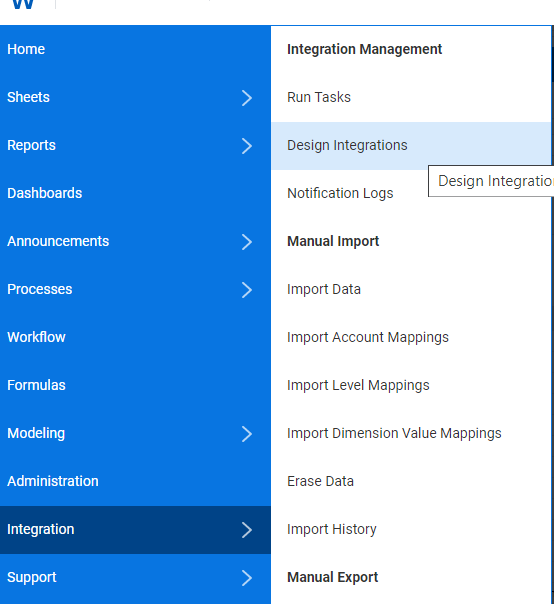
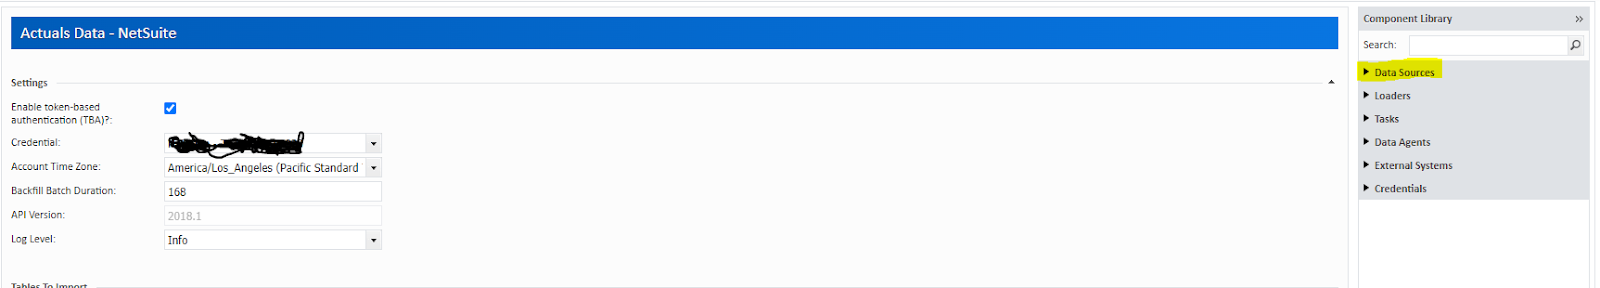
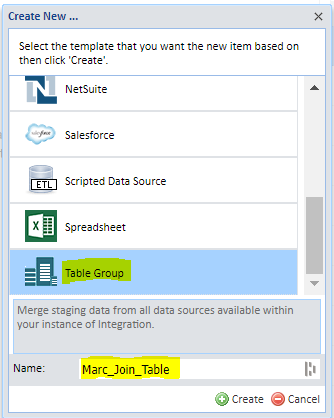
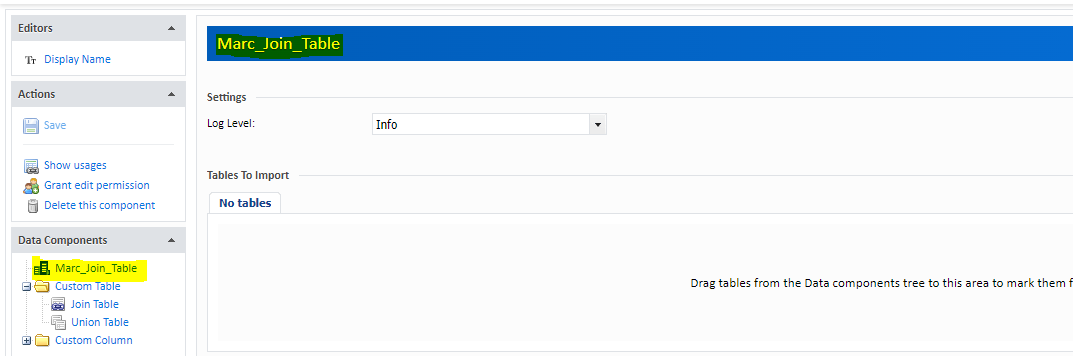
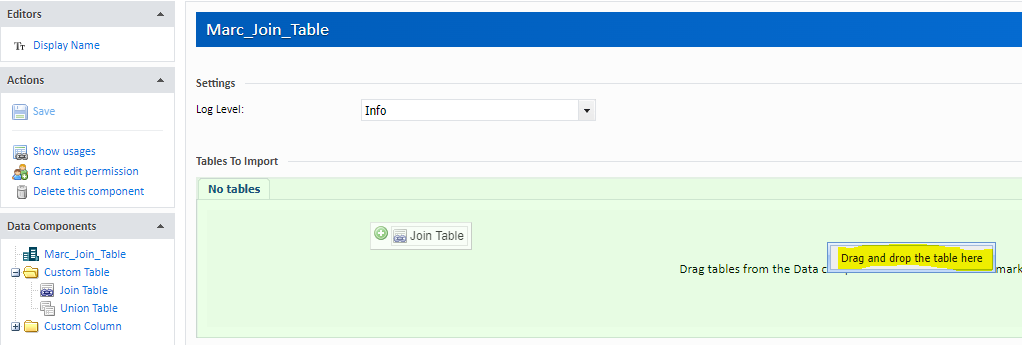
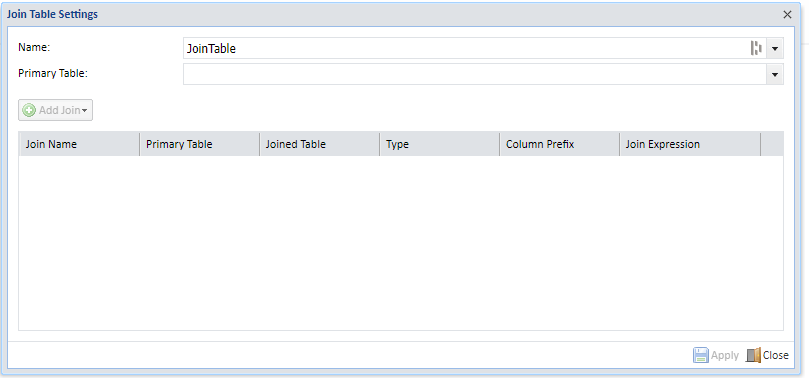
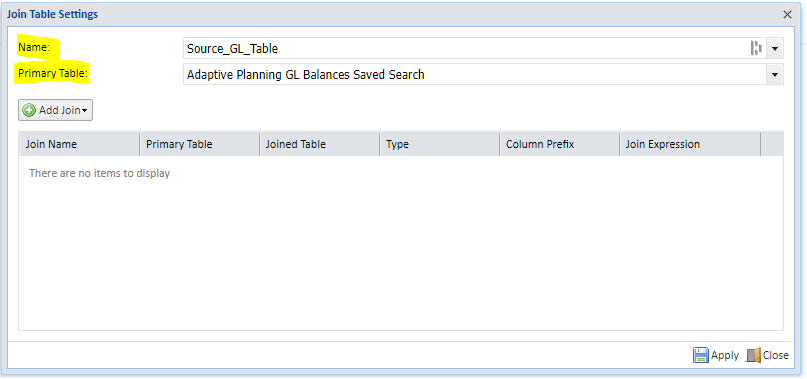
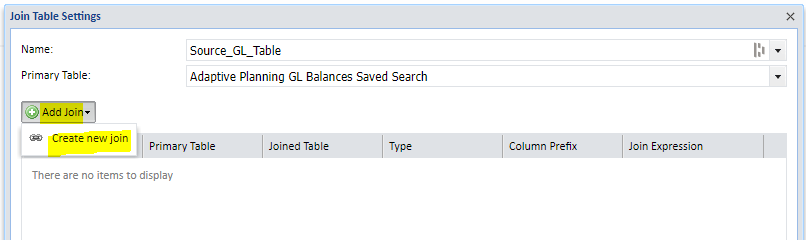
How We Helped: Revelwood integrated Workday Adaptive Planning with MarkSystems Home Builder Software. Revelwood built a cash flow model that incorporates detailed loan information. The cash flow modeling, analysis and reporting solution relies on data sets for “draws.” A draw schedule is a detailed payment plan that determines when a bank will disburse funds to the home building company. The company how has a sophisticated and comprehensive view of cash flow based on projects, payments and milestones.
Do you have a challenge you’d like to leverage Workday Adaptive Planning for? Reach out to us – we can help!
Read the posts in our series, How We Solve Problems Using Workday Adaptive Planning
How We Solve Problems: Improving the Performance of Workday Adaptive Planning