This is a guest post and video by Revelwood’s Jay Apwah.
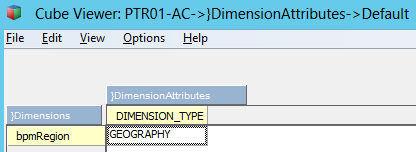
Did you know IBM Planning Analytics Workspace enables you to perform analysis on data in attribute-based hierarchies? Hierarchies are commonly used for analysis, but can also be used for filtering as well.
Watch this short video for an overview and demo of attribute-based hierarchies in Planning Analytics Workspace and you’ll learn:
- What hierarchies are
- Why you’ll want to use hierarchies
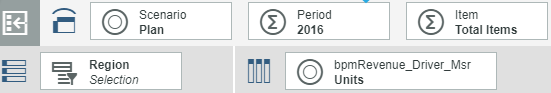
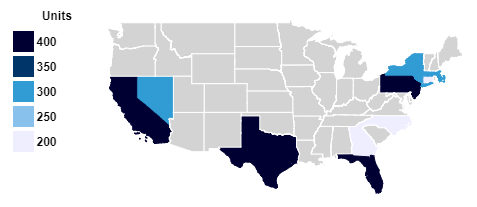
- How easy it is to create hierarchies, input data, and then analyze that data in those groupings
IBM Planning Analytics is full of new features and functionality. Not sure where to start? Our team here at Revelwood can help. Contact us for more information at info@revelwood.com. And stay tuned for more Planning Analytics Tips & Tricks weekly in our Knowledge Center and in upcoming newsletters!