Did you know IBM Planning Analytics has snap commands that allow you to use natural language wording to perform simple tasks? One example of this entails the use of sorting data within a view.
We can start with a simple view that shows operating expenses by quarter.
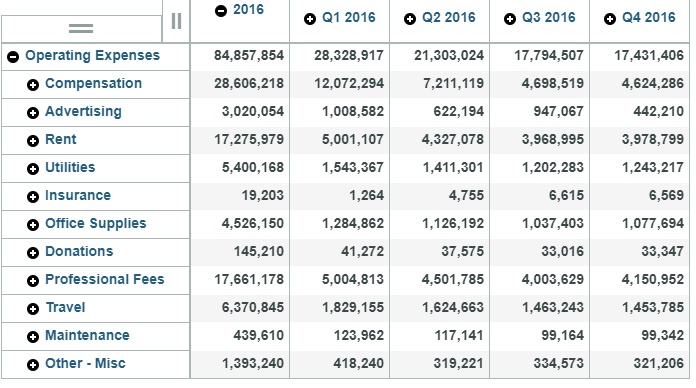
We can sort this by simply typing “sort Q1 2016” into the snap command window.
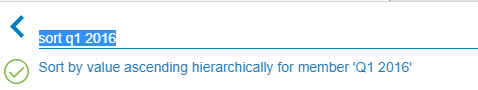
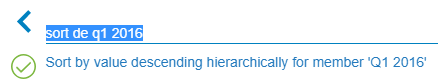
By default, the sort command sorts the values in ascending order. We can sort data in descending order by adding “descending”, “des”, or “de” in front of the time period.
In addition to defining the order, the sort command allows for parameters that define row vs. column sorting and allow you to break the hierarchy when sorting.
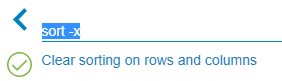
Once we have completed our analysis, we can reset the view and clear all sorting by typing “sort -x”.
There are many different ways to sort your data and Planning Analytics’ snap commands allow you to use them in your analyses.
IBM Planning Analytics, which TM1 is the engine for, is full of new features and functionality. Not sure where to start? Our team here at Revelwood can help. Contact us for more information at info@revelwood.com. And stay tuned for more Planning Analytics Tips & Tricks weekly in our Knowledge Center and in upcoming newsletters!
Learn more IBM Planning Analytics Tips & Tricks:
IBM Planning Analytics Tips & Tricks: Creating Selectors in Planning Analytics Workspace
IBM Planning Analytics Tips & Tricks: Creating Buttons in Planning Analytics Workspace
IBM Planning Analytics Tips & Tricks: Synchronizing Selectors in Planning Analytics Workspace