This is a guest blog post from Revelwood’s Shane Bethea.
Did you know that you can use the IBM Planning Analytics for Excel (PAx) Set Editor to create dynamic sets to be used in a view?
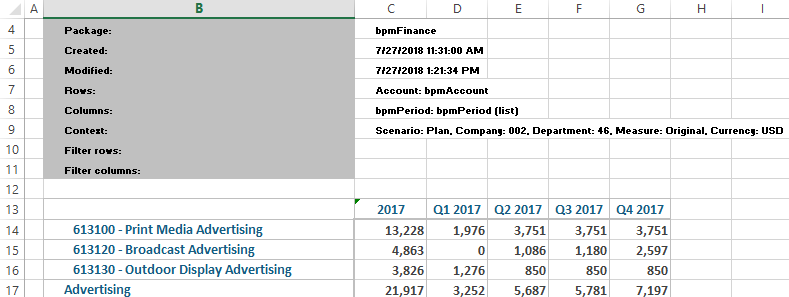
This can be accomplished by using the ‘Search available members’ bar in the set editor. I will use the bpmAccount dimension in this example.
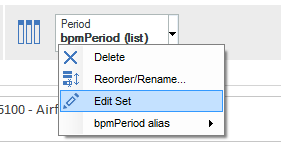
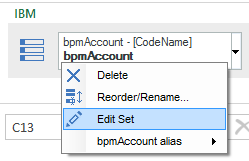
Start by opening the set editor in PAx. Right click the bpmAccount dimension (or click the drop down arrow by the dimension name) and choose Edit Set.
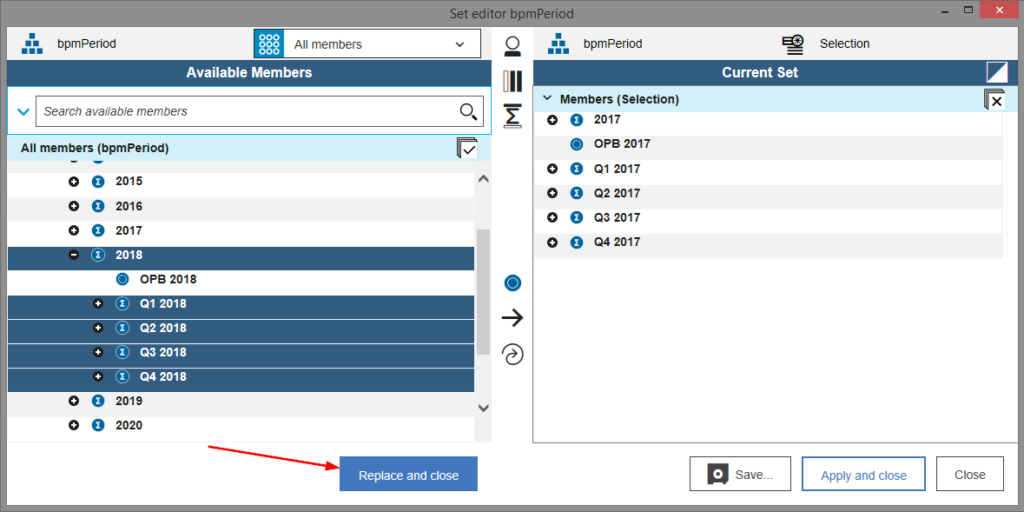
In the PAx Set Editor, enter your search criteria into the ‘Search available members’ bar and click the search button. If you have multiple criteria, such as a certain naming convention or attribute values, you can add to your search by clicking the drop down arrow to the left of the search bar. For this example, I will search for all accounts that have ‘COGS’ in the name.
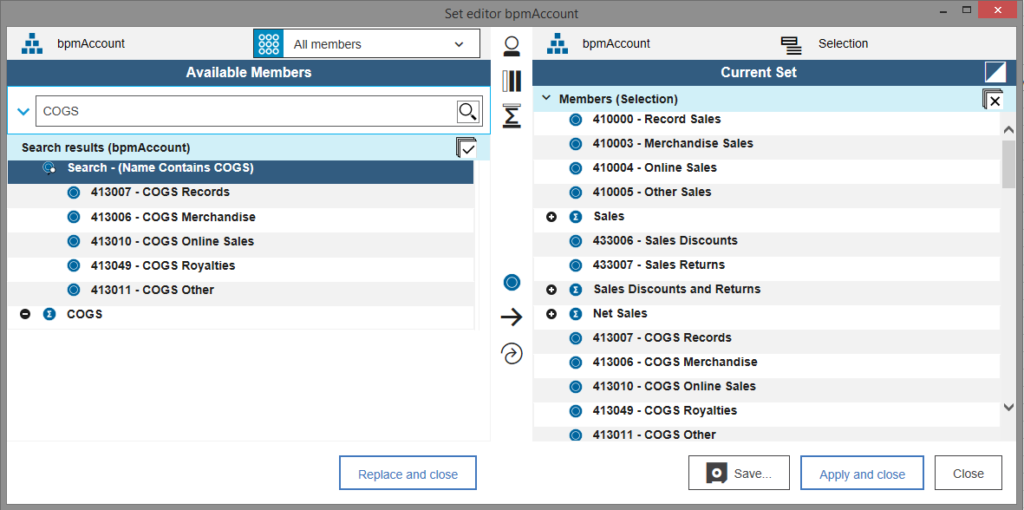
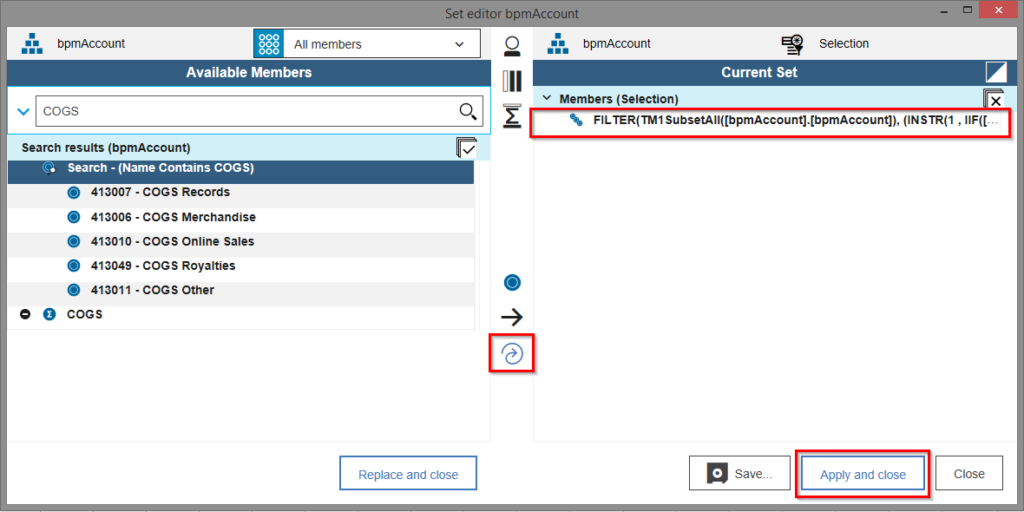
The results of the search display all elements with ‘COGS’ in the name. Look closely and you’ll notice the very first node of the results is an entry that says ‘Search – (Name Contains COGS)’. If I select that node and choose the ‘Replace set with new insertion’ button, the MDX query that makes up that search will be moved into the Current Set section. Once ‘Apply and close’ is selected, the set will be a dynamic set. Anytime a new element is added with ‘COGS’ in the name, it will automatically be added to the set.
This approach of defining criteria and creating a dynamic set will ensure that your report will always contain the correct set of elements.
IBM Planning Analytics is full of new features and functionality. Not sure where to start? Our team here at Revelwood can help. Contact us for more information at info@revelwood.com. And stay tuned for more Planning Analytics Tips & Tricks weekly in our Knowledge Center and in upcoming newsletters!
Read more blog posts on IBM Planning Analytics Tips & Tricks:
IBM Planning Analytics Tips & Tricks: PAx VBA API Calls
IBM Planning Analytics Tips & Tricks: Asymmetrical Axis in PAx
IBM Planning Analytics Tips & Tricks: Converting Reports to PAx