Did you know IBM Planning Analytics’ snap commands can serve as a spellcheck for you?
In today’s Twitter and text based world, misspellings (or abbreviations, as some people call them) have become a way of life. It’s virtually impossible to make it through a day without seeing a reference to “ur”, “imho” or some other form of abbreviation.
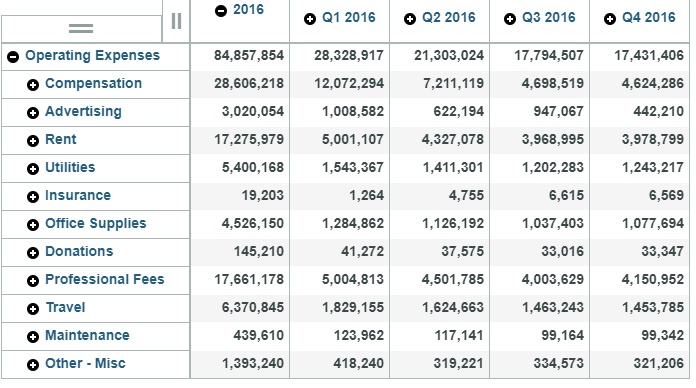
For those of you who use these abbreviations regularly, you will be happy to know that IBM Planning Analytics has your back! PA’s snap commands allow you to use natural language wording to perform simple tasks. It allows you type phrases such as “sort May 2016” and “hide Jun 2016”. It also allows you to abbreviate these commands as “so May 2016” and “hi jun 2016”.

And for those of you who struggle with spelling, PA has your back yet again! The snap commands will help fix any spelling mistakes.
In a situation where there is only one possible option, the snap command will correct your typo. Here is an example where “trave” is obviously a typo for “travel”.

In a situation where there are multiple options, the snap command will let you select which option should be the proper correction. Here is an example where “trvel” can reference an account called travel or refer to something associated with a level.

I’m happy to stand on my soap box and complain about the lack of grammer and speeling [sic] in today’s world, but I also understand that it’s sometimes much easier to let Planning Analytics help minimize my worries.
IBM Planning Analytics is full of new features and functionality. Not sure where to start? Our team here at Revelwood can help. Contact us for more information at info@revelwood.com. And stay tuned for more Planning Analytics Tips & Tricks weekly in our Knowledge Center and in upcoming newsletters!
Learn more IBM Planning Analytics Tips & Tricks:
IBM Planning Analytics Tips & Tricks: Creating Selectors in Planning Analytics Workspace
IBM Planning Analytics Tips & Tricks: Creating Buttons in Planning Analytics Workspace
IBM Planning Analytics Tips & Tricks: Synchronizing Selectors in Planning Analytics Workspace