Do you know how to use IBM Planning Analytics Workspace (PAW) to access error logs from your TurboIntegrator (TI) processes? It’s as simple as a single click!
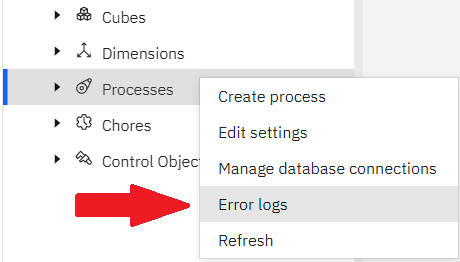
To access your logs, right-click on the Processes node in the workbench and select the option for Error logs.
Once selected, a popup window will appear with a list of the existing logs. This window allows you to sort the list by process name or by date created.
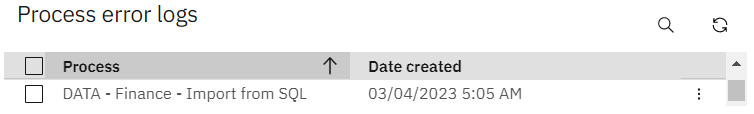
There are two ways to view a log file:
- Click on the box to the left of the process name
- Click on the three vertical dots to the right of the date
Both methods will then let you view the log file or download the file.
This feature, when combined with PAW’s development tools, will allow you to fully develop and debug TurboIntegrator scripts using the PAW interface.
IBM Planning Analytics, which TM1 is the engine for, is full of new features and functionality. Not sure where to start? Our team here at Revelwood can help. Contact us for more information at info@revelwood.com. And stay tuned for more Planning Analytics Tips & Tricks weekly in our Knowledge Center and in upcoming newsletters!
Read more IBM Planning Analytics Tips & Tricks:
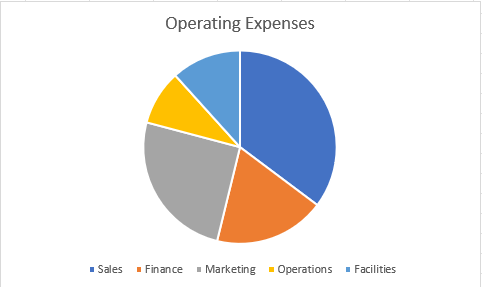
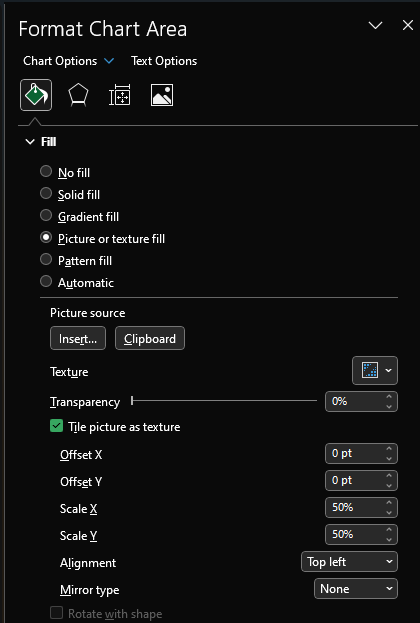
IBM Planning Analytics Tips & Tricks: Adding Images to Charts
IBM Planning Analytics Tips & Tricks: Popular Video Tips, Part 3
IBM Planning Analytics Tips & Tricks: Counting Hidden Rows in Excel