With a clever combination of formulas, you can have Excel calculate the number of hidden rows in a data set. This trick will work on both manually hidden rows and autotfilter hidden rows.
There are two ways to count hidden rows, depending on how your data is structured. Both methods use the AGGREGATE function.
The syntax of AGGREGATE is:
=AGGREGATE(function_num,options,array)
Where
Function_num is one of the following:
| Function_num | Function |
| 1 | AVERAGE |
| 2 | COUNT |
| 3 | COUNTA |
| 4 | MAX |
| 5 | MIN |
| 6 | PRODUCT |
| 7 | STDEV.S |
| 8 | STDEV.P |
| 9 | SUM |
| 10 | VAR.S |
| 11 | VAR.P |
| 12 | MEDIAN |
| 13 | MODE.SNGL |
| 14 | LARGE |
| 15 | SMALL |
| 16 | PERCENTILE.INC |
| 17 | QUARTILE.INC |
| 18 | PERCENTILE.EXC |
| 19 | QUARTILE.EXC |
And options are one of the following:
| Option | Behavior |
| Default | Ignore nested SUBTOTAL and AGGREGATE functions |
| 1 | Ignore hidden rows, nested SUBTOTAL and AGGREGATE functions |
| 2 | Ignore error values, nested SUBTOTAL and AGGREGATE functions |
| 3 | Ignore hidden rows, error values, nested SUBTOTAL and AGGREGATE functions |
| 4 | Ignore nothing |
| 5 | Ignore hidden rows |
| 6 | Ignore error values |
| 7 | Ignore hidden rows and error values |
We will be leveraging option 5: Ignore hidden rows
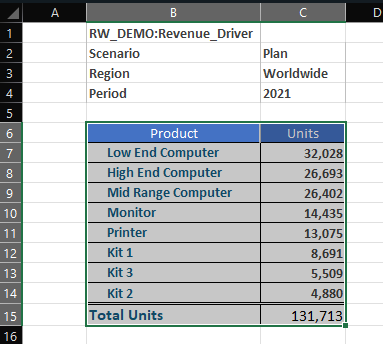
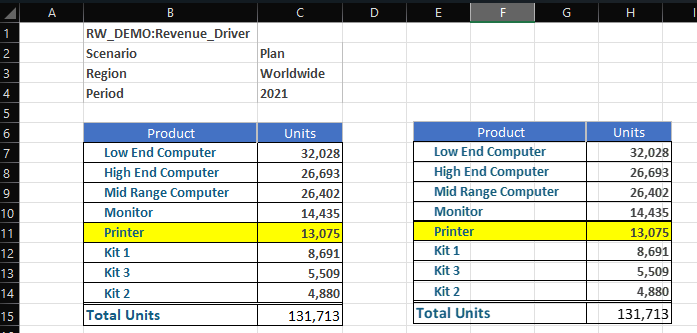
Consider the example data set:

Blank cells merit special treatment and will determine which method you use.
No Blanks in Data
If your data will have no blank (zeros are ok) like column D in the sample data set, you can use this formula to count the hidden rows:
=AGGREGATE(2,4,Table1[Feb])-AGGREGATE(2,5,Table1[Feb])
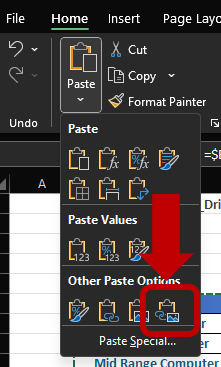
Blanks in Data

If there are blanks in the data (as in column C), you will need to add a helper column in Excel. The helper column will use AGGREGATE for the cell in the same row and this converts a blank into a 0. Use the same formula as the first method but use the helper column instead of the original data.
=AGGREGATE(2,4,G3:G7)-AGGREGATE(2,5,G3:G7)
IBM Planning Analytics, which TM1 is the engine for, is full of new features and functionality. Not sure where to start? Our team here at Revelwood can help. Contact us for more information at info@revelwood.com. And stay tuned for more Planning Analytics Tips & Tricks weekly in our Knowledge Center and in upcoming newsletters!
Read more IBM Planning Analytics Tips & Tricks:
IBM Planning Analytics Tips & Tricks: Headcount Analysis
IBM Planning Analytics Tips & Tricks: Waterfall Charts
IBM Planning Analytics Tips & Tricks: Planning Analytics Workspace (PAx) Zoom Bar