Workforce planning has become a necessity for all organizations. It allows human resources (HR) to work alongside Finance professionals to plan the organization’s workforce allocation and to achieve business goals. Unfortunately, most workforce planning models are outdated and lack predictive analytics. However, Workday Adaptive Planning enables organizations to take workforce planning to the next level.
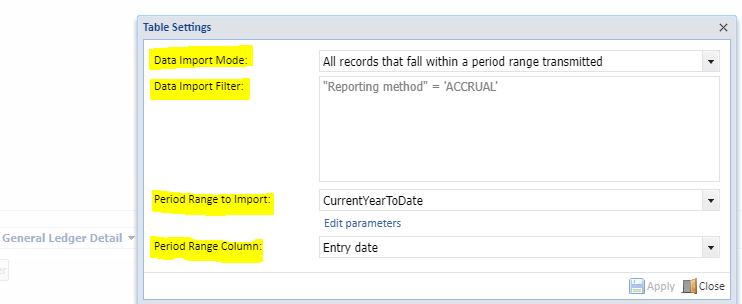
First, the data needs to be gathered about the workforce. Headcount, pay rate, the level each employee belongs to, benefits, bonus percentage, start and end dates are some categories that are commonly used in workforce planning models. Workday Adaptive Planning can integrate data from directly from source systems, ensuring the data is constantly updated. This is vital for the types of data required for workforce planning.
Key Capabilities of Workforce Planning in Adaptive Planning
Workday Adaptive Planning lets organizations:
- Plan workforce using dimensionality that aligns to the organization’s structure. These include some of the categories above and levels, departments, projects, locations, FTE vs part-time employees, and much more.
- Model hiring, transfers, and retention plans to understand the implications and to see the cost impact of data updates or changes to key drivers organized by parent organization or cost center.
- Use different driver-based scenarios to understand the effect of upstream and downstream to create the best plan possible.
- Conduct what-if labor analysis on different subjects such as salary increases, bonuses and equity and pool some of those categories together across different business units.
- Strategically plan for and model the repercussions of one-time events, such as restructures or M&A activities, regulatory changes, special projects or initiatives, and more.
Security Settings
Workday Adaptive Planning allows administrators to set permissions. Permissions can be given to restrict access based on job roles and responsibilities. These can be assigned at a granular level to ensure that users have access only to the necessary data and functionalities.
Notably, Workday Adaptive Planning prioritizes security with role-based access controls and granular permissions, ensuring data integrity and confidentiality. By embracing this innovative solution, organizations can optimize their workforce planning processes, encouraging agility, strategic foresight, and resilience for sustained success.
Ultimately, workforce planning is essential for organizational success, and Workday Adaptive Planning revolutionizes this practice by offering dynamic data integration, scenario modeling, and in-depth analyses. The platform’s advanced features enable organizations to align their workforce with business goals effectively.
Revelwood is an award-winning, Platinum Solution Provider for Workday Adaptive Planning. We build solutions for the Office of Finance that minimize your risk by seamlessly incorporating business analytics into your everyday thinking. By combining the software with our best practices and out-of-the-box applications, we help businesses achieve their full potential with Workday Adaptive Planning.
Read more Workday Adaptive Planning Tips & Tricks:
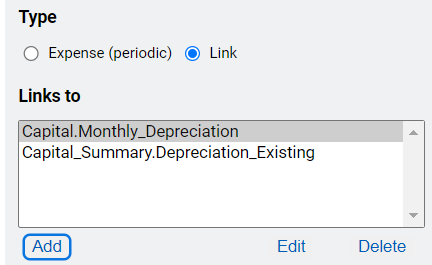
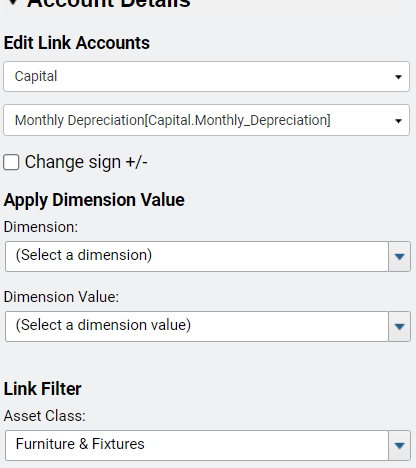
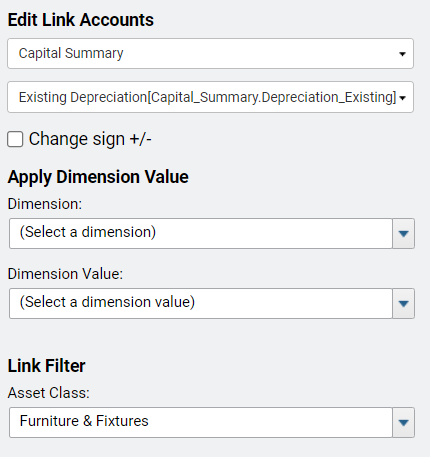
Workday Adaptive Planning Tips & Tricks: Linked Accounts with Link Filter
Workday Adaptive Planning Tips & Tricks: Importing with Ease
Workday Adaptive Planning Tips & Tricks: A Practical Guide to Shared Formula Import