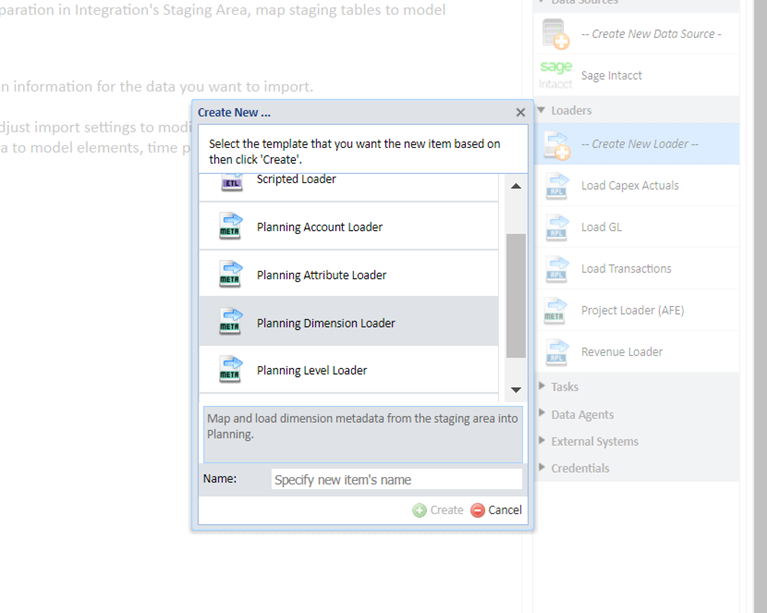
A key component of Workday Adaptive Planning is the ability to pull in actual data through integration. However, there is more you can do with this access to the data source. There is the ability to load in dimensions from the data source and have them automatically added to that specific dimension. This is done through a Metadata Loader. A Metadata Loader can only bring in one dimension at a time, but it will connect to an existing dimension and add any new values that are loaded into the data source.
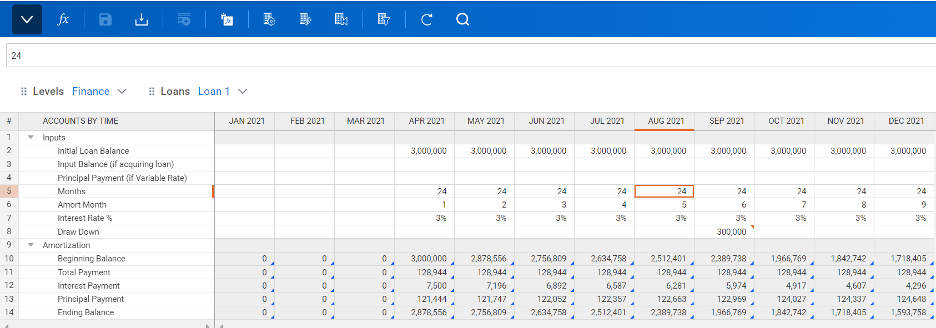
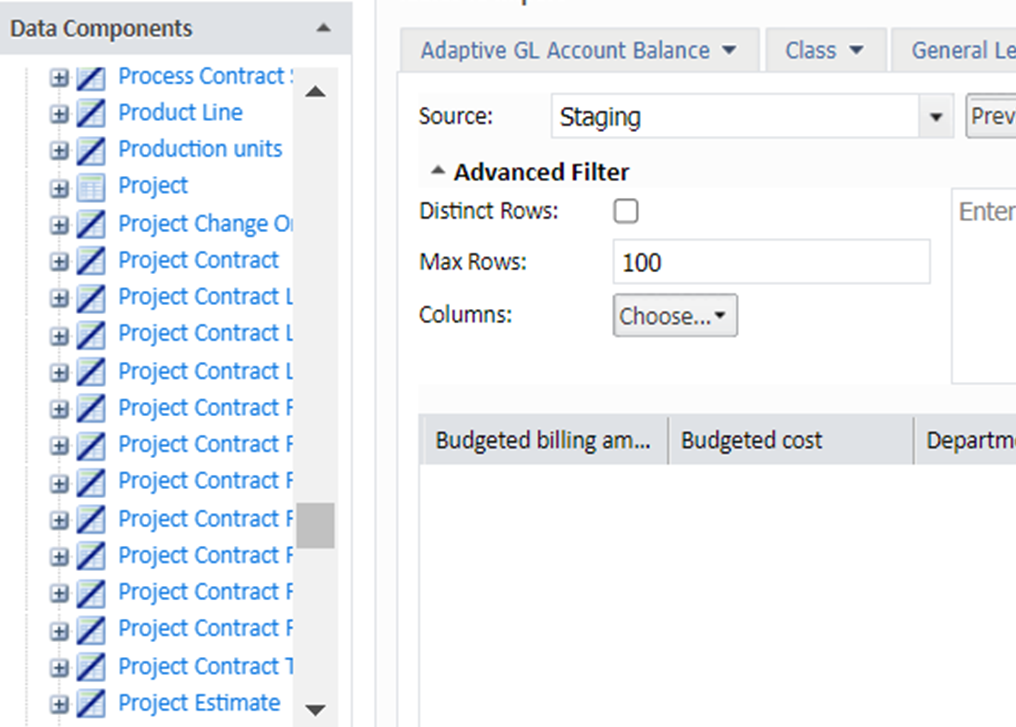
In order to create this loader, the correct data table must be brought in the source data, as depicted below.
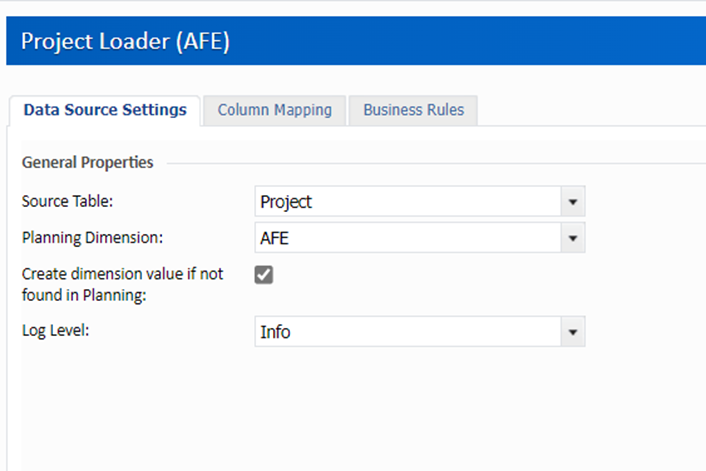
The next step consists of creating the planning dimension loader and filling out the Data Source Settings for the dimension. You would select the newly added data table as the source table. You then select the planning dimension it correlates with already in the instance.
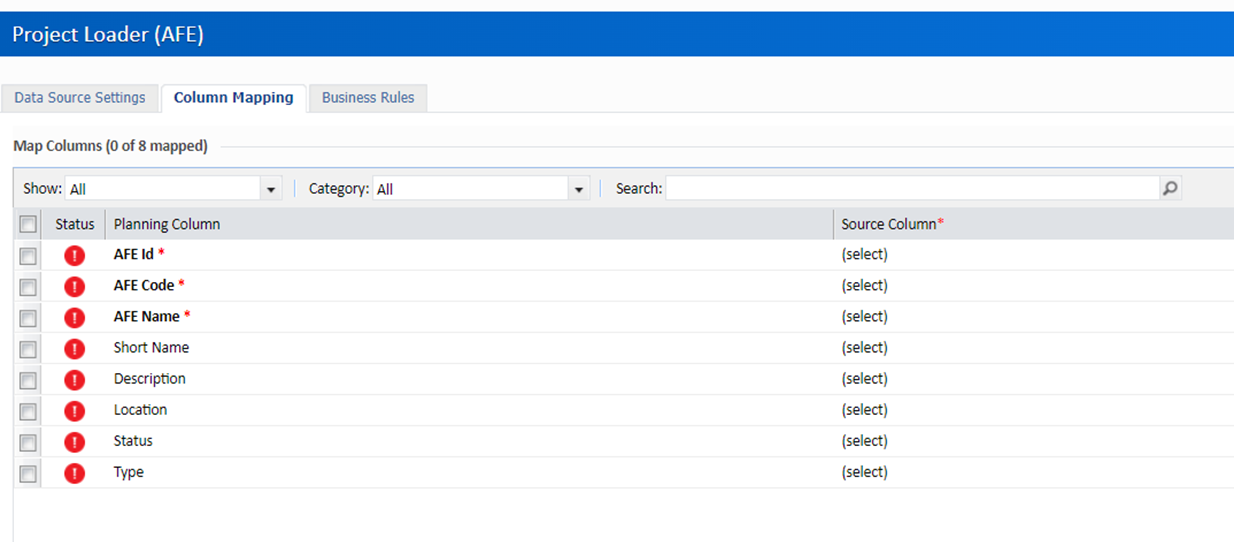
Lastly, you map the columns, based on the source table, to ensure the necessary details are pulled in.
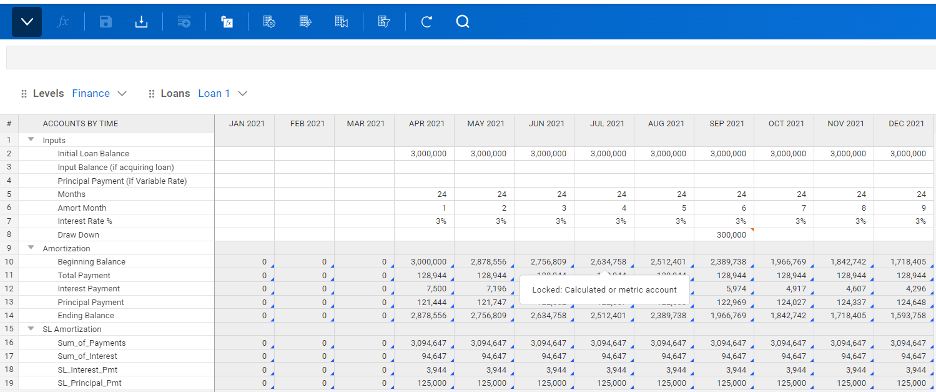
In order to ensure the correct names and codes are being pulled in correctly, it is recommended to run a preview of the output. If the loader was done correctly, a file will be produced that displays the desired information. From here, the loader is ready to be added to a task so that it will run as often as desired.
Revelwood is an award-winning, Platinum Workday Adaptive Planning partner. We build solutions for the Office of Finance that minimize your risk by seamlessly incorporating business analytics into your everyday thinking. Combining the software with our best practices and out-of-the-box applications, we help businesses achieve their full potential with Workday Adaptive Planning.
Read more Workday Adaptive Planning Tips & Tricks:
Workday Adaptive Planning Tips & Tricks: Reordering Parent and Children Cube Accounts in Cube Sheets
Workday Adaptive Planning Framework: Purchase Order Management for Organization-Wide Planning
Workday Adaptive Planning Tips & Tricks: Adaptive Displays – Sheets