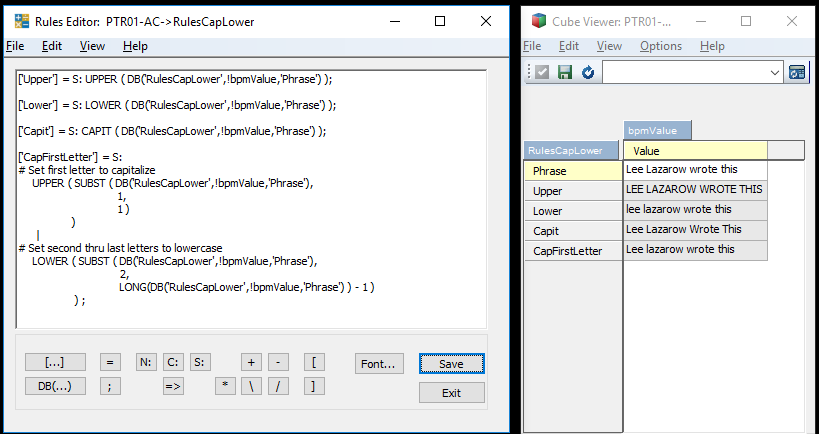
• Skip to main content
  • Skip to footer
Revelwood Logo

Revelwood

Your SUPER-powered WP Engine Site

  • Who We Are
    • About Us
      • Our Company
      • Our Team
      • Partners
    • Careers
      • Join Our Team
  • What We Do
    • Solutions
      • Workday Adaptive Planning
      • IBM Planning Analytics
      • BlackLine
    • Services
      • Implementation Services
      • Customer Care
        • Help Desk
        • System Administration as a Service
      • Training
        • Workday Adaptive Planning Training
        • IBM Planning Analytics / TM1 Training
    • Products
      • DataMaestro
      • LightSpeed
      • IBM Planning Analytics Utilities
  • How We Help
    • Use Cases
    • Client Success Stories
  • How We Think
    • Knowledge Center
    • Events
    • News
  • Contact Us

Budgeting Planning & Forecasting

IBM Planning Analytics Tips & Tricks: Ways to Stop a TI Process

July 9, 2019 by Lee Lazarow Leave a Comment

Tips & Tricks

Did you know there are two different ways to stop a TurboIntegrator script?

The ProcessBreak command stops processing source data and proceeds directly to the Epilog.  This approach allows you still run code in the Epilog that can perform tasks such as deleting subsets, writing to a process tracking cube, or running other processes.

Here is an example of skipping the data and metadata section if a parameter called pVersion does not exist:

            IF ( DIMIX ( ‘Version’, pVersion) = 0 );
                 PROCESSBREAK;
            ENDIF;

As you can see, there are no parameters to this command.  You use this by simply telling Planning Analytics to go to the Epilog.

If, however, you want to completely end the process then you can use the ProcessQuit command.  This command completely terminates the process without running anything in the Epilog.  Here is an example of doing the same check with ProcessQuit.

            IF ( DIMIX ( ‘Version’, pVersion) = 0 );
                 PROCESSQUIT;
            ENDIF;

It’s up to you to determine how you want to stop a TI script from processing.

IBM Planning Analytics, which TM1 is the engine for, is full of new features and functionality. Not sure where to start? Our team here at Revelwood can help. Contact us for more information at info@revelwood.com. And stay tuned for more Planning Analytics Tips & Tricks weekly in our Knowledge Center and in upcoming newsletters!

Learn more IBM Planning Analytics Tips & Tricks:

IBM Planning Analytics Tips & Tricks: Ways to Skip a Record Using a TI Process

IBM Planning Analytics Tips & Tricks: Creating Selectors in Planning Analytics Workspace

IBM Planning Analytics Tips & Tricks: Creating Buttons in Planning Analytics Workspace

Need more guidance? Take a look at our IBM Planning Analytics Training services and our Customer Care Program.

Home » Budgeting Planning & Forecasting » Page 17

Filed Under: IBM Planning Analytics Tips & Tricks Tagged With: Analytics, Budgeting, Budgeting Planning & Forecasting, Financial Performance Management, IBM Planning Analytics, Planning & Reporting, TM1

IBM Planning Analytics Tips & Tricks: Ways to Skip a Record Using a TI Process

July 2, 2019 by Lee Lazarow Leave a Comment

Tips & Tricks

Did you know there are two different ways to skip specific records when you are running TurboIntegrator scripts?

ItemSkip is used to skip a specific record. This is often nested within an IF statement and used when you want to simply ignore a record. Here is an example of skipping a record if a variable called vValue is negative:

            IF ( vValue < 0 );
                 ITEMSKIP;
            ENDIF;

As you can see, there are no parameters to this command. You use this by simply telling Planning Analytics to skip the record.

If, however, you want to skip the record and create a record in the error log then you can use the ItemReject command. This command allows you to customize the message that appears in the log. Here is an example of rejecting the same record using ItemReject.

            IF ( vValue < 0 );
                 ITEMREJECT (‘The value is less than zero.’);
            ENDIF;

It’s up to you to determine how you want to skip records.

IBM Planning Analytics, which TM1 is the engine for, is full of new features and functionality. Not sure where to start? Our team here at Revelwood can help. Contact us for more information at info@revelwood.com. And stay tuned for more Planning Analytics Tips & Tricks weekly in our Knowledge Center and in upcoming newsletters!

Learn more IBM Planning Analytics Tips & Tricks:

IBM Planning Analytics Tips & Tricks: Creating Selectors in Planning Analytics Workspace

IBM Planning Analytics Tips & Tricks: Creating Buttons in Planning Analytics Workspace

IBM Planning Analytics Tips & Tricks: Synchronizing Selectors in Planning Analytics Workspace

Home » Budgeting Planning & Forecasting » Page 17

Filed Under: IBM Planning Analytics Tips & Tricks Tagged With: Analytics, Budgeting, Budgeting Planning & Forecasting, Financial Performance Management, IBM Planning Analytics, Planning & Reporting, TM1

Revelwood Partners Adaptive Insights and IBM Earn High Ratings in BPM Partners’ BPM Pulse Survey

June 27, 2019 by Lisa Minneci Leave a Comment

Awards & Recognition

BPM Partners’ BPM Pulse Survey is in its 16th year, and yet again Revelwood partners Adaptive Insights and IBM have both earned high ratings in the annual survey of business performance management vendors.

General Trends in the Business Performance Management Market

According to Craig Schiff of BPM Partners, the survey revealed that users of performance management systems are primarily looking for three main features when they evaluate BPM solutions:

  • Ease of use;
  • Performance and scalability; and
  • A single user interface for budget owners outside of finance.

Additionally, Schiff mentioned that users strongly prefer vendors who have integrations with existing systems.

This year’s survey revealed a very interesting key trend: the “rebirth” of dashboards. Users reported that they’ve added dashboards on to most projects, that dashboards are used to deliver analytics, that they have a desire for interactive, drillable dashboards, and that in some cases they have multiple dashboards throughout a solution for specific use cases.

The BPM Pulse survey also found that users have a focus on granular profitability analysis. That focus, however, is different based on industry. Currently the pre-packaged options are limited. It also creates system challenges around volume and performance.

Adaptive Insights’ Rating in the BPM Pulse Survey

Adaptive was named a top-rated vendor in 2019 for the key category of budgeting/planning functionality. The company had an overall score of 4.31 (out of 5) and was cited for its extended market reach, AI capabilities and anomaly detection. Adaptive Insights was also recognized for its comprehensive solution, integrations, data visualization, operational analytics, collaboration, and clean/intuitive user interface.  The survey found that Adaptive Insights was most often selected for its product flexibility. Its highest functional rating in the BPM Pulse survey was for budgeting/planning.

BPM Partners BPM Pulse Survey Adaptive Insights Ratings

IBM’s Rating in the BPM Pulse Survey

IBM was named a top-rated vendor for Planning Analytics’ budgeting/planning functionality as well. The company had an overall score of 4.28. The webinar for the BPM Pulse Survey cited the company’s business performance management offerings’ latest enhancements as including “cloud-based administration and modeling, seamless switching between web and Excel views, and more. Users selected Planning Analytics for its product flexibility and its highest functional rating in the BPM Pulse survey was for reporting.

BPM Partners BPM Pulse Survey IBM and IBM Planning Analytics Ratings

 Watch BPM Partners’ webinar – in conjunction with Industry Week – here.

Home » Budgeting Planning & Forecasting » Page 17

Filed Under: Awards & Recognition Tagged With: Adaptive Insights, Budgeting, Budgeting Planning & Forecasting, Financial Performance Management, IBM Planning Analytics, Planning & Reporting, TM1

IBM Planning Analytics Tips & Tricks: Best Practices for Hierarchies

June 25, 2019 by Nina Inverso Leave a Comment

Tips & Tricks

Did you know IBM Planning Analytics hierarchies are used to see alternative data rollups in the same view? By default, all dimensions include a single hierarchy based on the original definition.

Creating multiple hierarchies in a dimension is initially disabled in Planning Analytics Workspace. The EnableNewHierarchyCreation parameter must be set to true in the server’s tm1s.cfg file to enable hierarchy creation. This is a static parameter, which means you will need to restart the server once you change the parameter value.

Hierarchies should be maintained via TurboIntegrator (TI) processes whenever possible. For example, when changes are made to the attribute that was originally used to create an attribute-based hierarchy, the associated hierarchy is not automatically updated. The user must delete and recreate the hierarchy to see the changes reflected in the model.

Hierarchies that have been created manually or via TI process can have any structure, while attribute-based hierarchies always have three levels: a total, the attribute values, and the leaves. A hierarchy must be maintained manually or via TI process if it is asymmetric, its elements belong to more than one parent, or it requires more than three levels.

IBM Planning Analytics, which TM1 is the engine for, is full of new features and functionality. Not sure where to start? Our team here at Revelwood can help. Contact us for more information at info@revelwood.com. And stay tuned for more Planning Analytics Tips & Tricks weekly in our Knowledge Center and in upcoming newsletters!

Read more IBM Planning Analytics Tips & Tricks Blogs:

IBM Planning Analytics Tips & Tricks: The Benefits of Using Hierarchies

IBM Planning Analytics Tips & Tricks: Creating a Simple Dashboard in Planning Analytics Workspace

IBM Planning Analytics Tips & Tricks: The Ranked Report

Need more guidance? Take a look at our IBM Planning Analytics Training services and our Customer Care Program.

Home » Budgeting Planning & Forecasting » Page 17

Filed Under: IBM Planning Analytics Tips & Tricks Tagged With: Budgeting, Budgeting Planning & Forecasting, Financial Performance Management, IBM Planning Analytics, Planning & Reporting, TM1

IBM Planning Analytics Tips & Tricks: How to Maintain a Hierarchy via a TurboIntegrator Process

June 18, 2019 by Revelwood Leave a Comment

Tips & Tricks

Did you know it is best practice to maintain a hierarchy in Planning Analytics via TurboIntegrator (TI) process whenever possible? There are five key functions that can be used to do so.

HierarchyExists(DimName, HierName)

HierarchyExists is used to determine whether a specific hierarchy already exists on the server. The first parameter is the name of the dimension that contains the hierarchy to check, and the second parameter is the name of the hierarchy to check.

HierarchyCreate(DimName, HierName)

HierarchyCreate is used to create a new hierarchy in an existing dimension. The first parameter is the name of the dimension in which to create the hierarchy, and the second parameter is the name of the hierarchy to create.

HierarchyDeleteAllElements(DimName, HierName)

HierarchyDeleteAllElements deletes all elements from a hierarchy. The first parameter is the name of the dimension in which the hierarchy exists, and the second parameter is the name of the hierarchy from which to delete all elements.

HierarchyElementInsert(DimName, HierName, InsertionPoint, ElName, ElType)

HierarchyElementInsert adds an element to a hierarchy. The first and second parameters are once again used to specify the names of the applicable dimension and hierarchy (respectively). The third parameter can be used to specify the element before which the new element will be inserted. If it’s left blank, the new element will be inserted at the end of the dimension. The fourth parameter is the name of the new element, and the fifth parameter is the element type. The letter N signifies a numeric element, the letter S signifies a string element, and the letter C signifies a consolidated element.

HierarchyElementComponentAdd(DimName, HierName, ConsolidatedElName, ElName, ElWeight)

HierarchyElementComponentAdd adds a child to a consolidated element. The first and second parameters are once again used to specify the names of the applicable dimension and hierarchy (respectively). The third parameter is the name of the parent or consolidated element, the fourth parameter is the name of the child element, and the fifth parameter is the weight of the child element in the consolidation.

The following code example is used to create the Delivery Format hierarchy in the Publication dimension of this server. The metadata section of the code could then use attribute values or information from the data source to determine where in the hierarchy to place each base level publication.

IBM Planning Analytics Tips & Tricks: How to maintain a hierarchy via a TurboIntegrator Process

The full list of hierarchy manipulation TI functions can be found here.

IBM Planning Analytics, which TM1 is the engine for, is full of new features and functionality. Not sure where to start? Our team here at Revelwood can help. Contact us for more information at info@revelwood.com. And stay tuned for more Planning Analytics Tips & Tricks weekly in our Knowledge Center and in upcoming newsletters!

Read more blog posts in the IBM Planning Analytics Tips & Tricks Series:

IBM Planning Analytics Tips & Tricks: The Benefits of Using Hierarchies

IBM Planning Analytics Tips & Tricks: Workarounds for Unsupported Excel Functions in TM1 Web

IBM Planning Analytics Tips & Tricks: Recaclulating Excel Worksheets

Need more help? Learn about our Customer Care options for IBM Planning Analytics & TM1 users. 

Home » Budgeting Planning & Forecasting » Page 17

Filed Under: IBM Planning Analytics Tips & Tricks Tagged With: Budgeting, Budgeting Planning & Forecasting, Financial Performance Management, IBM Planning Analytics, Planning & Reporting, TM1

IBM Planning Analytics Tips & Tricks: Troubleshooting Planning Analytics for Excel

June 11, 2019 by Alex Needham Leave a Comment

Tips & Tricks

Did you know there are some easy approaches to troubleshooting IBM Planning Analytics for Excel (PAx)?

Given that PAx is an Excel add-in, sometimes things go wrong. Do you know the basic steps to take when a user says that PAx isn’t working for them?

We at Revelwood have often seen two primary issues that appear at our clients:

  1. The “IBM Planning Analytics” ribbon doesn’t show up
  2. A user can connect in, but they cannot see anything in the task pane

So, let’s take a look at how to solve either of these two primary issues.

Issue 1 – The IBM Planning Analytics ribbon doesn’t show up

In our experience, this is almost always an issue of one of the three add-ins not showing up properly. PAx depends on 3 add-ins within excel. If you open “File”, “Options”, “Add-ins” in Excel, you should see the following list:

IBM Planning Analytics Tips & Tricks: Troubleshooting PAx

Chances are that at least one of these three add-ins are missing. At the bottom of this window is a “Manage” option. If you are missing either of the “IBM Cognos Office…” items, you’ll want to select “Excel Add-ins” from the drop down. If you are missing “IBM Framework for Office”, you’ll want to select “COM Add-ins” from the dropdown.

  • IBM Cognos Office Reporting BI Addin (Excel Add-ins)
    • C:\Program Files (x86)\ibm\cognos\IBM for Microsoft Office\CognosOfficeBI.xll
  • IBM Cognos Office Reporting TM1 Addin (Excel Add-ins)
    • C:\Program Files (x86)\ibm\cognos\IBM for Microsoft Office\CognosOfficeTM1.xll
  • IBM Framework for Office (COM Add-ins)
    • C:\Program Files (x86)\ibm\cognos\IBM for Microsoft Office\CognosOfficeShim12.dll

NOTE: If you are running 64 bit, then those will all start with “C:\Program Files\” instead.

Issue 2 – Nothing is showing up in the task pane in Planning Analytics for Excel

Troubleshooting PAx - IBM Planning Analytics Tips & Tricks

This usually happens when a client is far behind on the monthly PAx and Planning Analytics Workspace updates, and there have been some sizable Windows updates since your last update. If you are not applying updates at least once a quarter, make sure to get in touch with us to see if we can help in staying up to date!

Thankfully, the quick band-aid fix for this is quite simple. Excel comes with the ability to turn on “Optimize for Compatibility” for Excel 2016 and newer. To do this, click “File” and then “Options” and look at the beginning of the “General” section. If you have “When using multiple displays” under “User Interface Options”, select “Optimize for compatibility”.

IBM Planning Analytics is full of new features and functionality. Not sure where to start? Our team here at Revelwood can help. Contact us for more information at info@revelwood.com. And stay tuned for more Planning Analytics Tips & Tricks weekly in our Knowledge Center and in upcoming newsletters!

Read more blog posts on IBM Planning Analytics Tips & Tricks:

IBM Planning Analytics Tips & Tricks: PAx VBA API Calls

IBM Planning Analytics Tips & Tricks: Asymmetrical Axis in PAx

IBM Planning Analytics Tips & Tricks: Converting Reports to PAx

Did you know Revelwood offers a Customer Care program? Learn more. 

Home » Budgeting Planning & Forecasting » Page 17

Filed Under: IBM Planning Analytics Tips & Tricks Tagged With: Analytics, Budgeting, Budgeting Planning & Forecasting, Customer Care program, Financial Performance Management, IBM Planning Analytics, Planning & Forecasting, Planning & Reporting, TM1

IBM Planning Analytics Tips & Tricks: The Planning Analytics Workspace Rule Editor, Part 2

June 4, 2019 by Revelwood Leave a Comment

Tips & Tricks

This is a guest post from Shane Bethea. 

Did you know there are new features in the IBM Planning Analytics Workspace (PAW) Rule editor that were not in the TM1 Rule editor? Even if you are familiar with writing rules in TM1, you might want some tips and tricks for the new Rule editor in PAW. Here are some helpful features of the new Rule editor.

One new feature in the PAW Rule editor is the autocomplete feature.  While editing rules, use CTRL+Space to bring up autocomplete.

  • type the letter s and CTRL+Space returns SKIPCHECK;
  • type [2 and CTRL+Space returns a list of all elements in the cube that start with 2
IBM Planning Analytics Tips & Tricks: Using the Planning Analytics Workspace Rule editor

Another helpful feature in the PAW Rule editor is a line by line warning of invalid code. If there is invalid code on a line, that line will have a red x indicator on the left side of the window. Hovering your mouse over the x will display the error message.

IBM Planning Analytics Tips & Tricks: Learning the Planning Analytics Workspace Rule Editor

These are just a couple of new features of the Rule editor widget in Planning Analytics Workspace. Stay tuned for more development tips and tricks in the new PAW modeling widgets.

IBM Planning Analytics, which TM1 is the engine for, is full of new features and functionality. Not sure where to start? Our team here at Revelwood can help. Contact us for more information at info@revelwood.com. And stay tuned for more Planning Analytics Tips & Tricks weekly in our Knowledge Center and in upcoming newsletters!

Read more blog posts in our IBM Planning Analytics Tips & Tricks Series:

IBM Planning Analytics Tips & Tricks: The Planning Analytics Workspace Rule Editor, Part 1

IBM Planning Analytics Tips & Tricks: Bookmarks in Planning Analytics Workspace

IBM Planning Analytics Tips & Tricks: The Collect Feature in Planning Analytics Workspace

Let us optimize your IBM Planning Analytics environment. Learn more about our Customer Care program. 

Home » Budgeting Planning & Forecasting » Page 17

Filed Under: IBM Planning Analytics Tips & Tricks Tagged With: Analytics, Budgeting Planning & Forecasting, Financial Performance Management, IBM Planning Analytics, Planning & Reporting, Planning Analytics Workspace, TM1

IBM Planning Analytics Tips & Tricks: The Planning Analytics Workspace Rule Editor, Part 1

May 28, 2019 by Revelwood Leave a Comment

Tips & Tricks

This is a guest post from Shane Bethea.

Did you know that most TM1/Planning Analytics development can now be done in Planning Analytics Workspace (PAW)? PAW has a lot of development capabilities and allows modelers to do most development that would have previously been done in Perspectives. In addition, PAW has new development capabilities that are not available in Perspectives.

There are six modeling widgets available in a PAW book.

  • Dimension editor
  • Cube creator
  • Rule editor
  • Process editor
  • Chore editor
  • Settings editor

This post will focus on the PAW Rule editor. The Rule editor looks very similar to the Advanced Rule editor in prior versions of TM1. It has easy to read, color coded formatting and code sections can be separated into collapsible regions.

To open the Rule editor, right click a cube and choose Edit business rules.

IBM Planning Analytics Tips & Tricks: Planning Analytics Workspace Rule Editor

In the Rule editor, you will notice two drop down selectors in the upper left corner of the window. These drop downs allow you to select the database and the cube that is being modified. This allows you to switch from cube to cube, which reduces the dependence on the navigation tree.

IBM Planning Analytics Tips & Tricks: Understanding the PAW rule editor

In the upper right corner, you can select the Function drop down to insert rule functions and get brief definitions of rule functions.

IBM Planning Analytics Tips & Tricks: Learning the PAW rule editor

Use the Settings drop down in the upper right corner to enable line wrapping, show/hide shortcut keys, and change font.

IBM Planning Analytics Tips & Tricks: How to use the PAW rule editor

This is a quick overview of the basic functionality of the Rule editor widget in Planning Analytics Workspace. Stay tuned for more entries covering the other features modeling widgets.

IBM Planning Analytics is full of new features and functionality. Not sure where to start? Our team here at Revelwood can help. Contact us for more information at info@revelwood.com. And stay tuned for more Planning Analytics Tips & Tricks weekly in our Knowledge Center and in upcoming newsletters!

Learn more about IBM Planning Analytics Workspace. Read these blog posts with IBM Planning Analytics Tips & Tricks.

IBM Planning Analytics Tips & Tricks: Creating Buttons in Planning Analytics Workspace (PAW)

IBM Planning Analytics Tips & Tricks: The Collect Feature in Planning Analytics Workspace (PAW)

IBM Planning Analytics Tips & Tricks: Creating a Simple Dashboard in Planning Analytics Workspace (PAW)

Get the most out of IBM Planning Analytics. Learn how we can help you through our Customer Care program.

Home » Budgeting Planning & Forecasting » Page 17

Filed Under: IBM Planning Analytics Tips & Tricks Tagged With: Analytics, Budgeting Planning & Forecasting, Financial Performance Management, IBM Planning Analytics, Planning & Forecasting, Planning & Reporting, Planning Analytics Workspace, TM1

IBM Planning Analytics Tips & Tricks: Snap Commands – Spelling

May 21, 2019 by Lee Lazarow Leave a Comment

Tips & Tricks

Did you know IBM Planning Analytics’ snap commands can serve as a spellcheck for you?

In today’s Twitter and text based world, misspellings (or abbreviations, as some people call them) have become a way of life. It’s virtually impossible to make it through a day without seeing a reference to “ur”, “imho” or some other form of abbreviation.

For those of you who use these abbreviations regularly, you will be happy to know that IBM Planning Analytics has your back! PA’s snap commands allow you to use natural language wording to perform simple tasks. It allows you type phrases such as “sort May 2016” and “hide Jun 2016”. It also allows you to abbreviate these commands as “so May 2016” and “hi jun 2016”.

IBM Planning Analytics Tips & Tricks: Snap Commands - Spelling

And for those of you who struggle with spelling, PA has your back yet again! The snap commands will help fix any spelling mistakes.

In a situation where there is only one possible option, the snap command will correct your typo. Here is an example where “trave” is obviously a typo for “travel”.

IBM Planning Analytics Tips & Tricks: Understanding snap commands and spelling

In a situation where there are multiple options, the snap command will let you select which option should be the proper correction.  Here is an example where “trvel” can reference an account called travel or refer to something associated with a level.

IBM Planning Analytics Tips & Tricks: Spelling with Snap Commands

I’m happy to stand on my soap box and complain about the lack of grammer and speeling [sic] in today’s world, but I also understand that it’s sometimes much easier to let Planning Analytics help minimize my worries.

IBM Planning Analytics is full of new features and functionality. Not sure where to start? Our team here at Revelwood can help. Contact us for more information at info@revelwood.com. And stay tuned for more Planning Analytics Tips & Tricks weekly in our Knowledge Center and in upcoming newsletters!

Learn more IBM Planning Analytics Tips & Tricks:

IBM Planning Analytics Tips & Tricks: Creating Selectors in Planning Analytics Workspace

IBM Planning Analytics Tips & Tricks: Creating Buttons in Planning Analytics Workspace

IBM Planning Analytics Tips & Tricks: Synchronizing Selectors in Planning Analytics Workspace

Need more guidance? Take a look at our IBM Planning Analytics Training services and our Customer Care Program.

Home » Budgeting Planning & Forecasting » Page 17

Filed Under: IBM Planning Analytics Tips & Tricks Tagged With: Analytics, Budgeting, Budgeting Planning & Forecasting, Financial Performance Management, IBM Planning Analytics, Planning & Forecasting, Planning & Reporting, TM1

  • « Go to Previous Page
  • Page 1
  • Interim pages omitted …
  • Page 15
  • Page 16
  • Page 17
  • Page 18
  • Page 19
  • Interim pages omitted …
  • Page 26
  • Go to Next Page »

Footer

Revelwood Overview

Revelwood helps finance organizations close, consolidate, plan, monitor and analyze business performance. As experts in solutions for the Office of Finance, we partner with best-in-breed software companies by applying best practices guidance and our pre-configured applications to help businesses achieve their full potential.

EXPERTISE

  • Workday Adaptive Planning
  • IBM Planning Analytics
  • BlackLine

ABOUT

  • Who We Are
  • What We Do
  • How We Help
  • How We Think
  • Privacy

CONNECT

World Headquarters

Florham Park, NJ | 201 984 3030

European Headquarters

London & Edinburgh | +44 (0)131 240 3866

Latin America Office

Miami, FL | 201 987 4198

Email
info@revelwood.com

Copyright © 2025 · Revelwood Inc. All rights reserved. Revelwood® and the Revelwood logo are registered marks of Revelwood Inc.