This is a guest post from Revelwood’s Shane Bethea.
Did you know IBM Planning Analytics Workspace (PAW) has a new feature that lets you easily duplicate sheets? Have you ever created a template or dashboard in PAW and thought, “This is a great format. I wish I could quickly replicate this sheet to show several different views of the same information?” PAW has a great feature called ‘Duplicate’ that will allow you to duplicate a sheet as many times as you want.
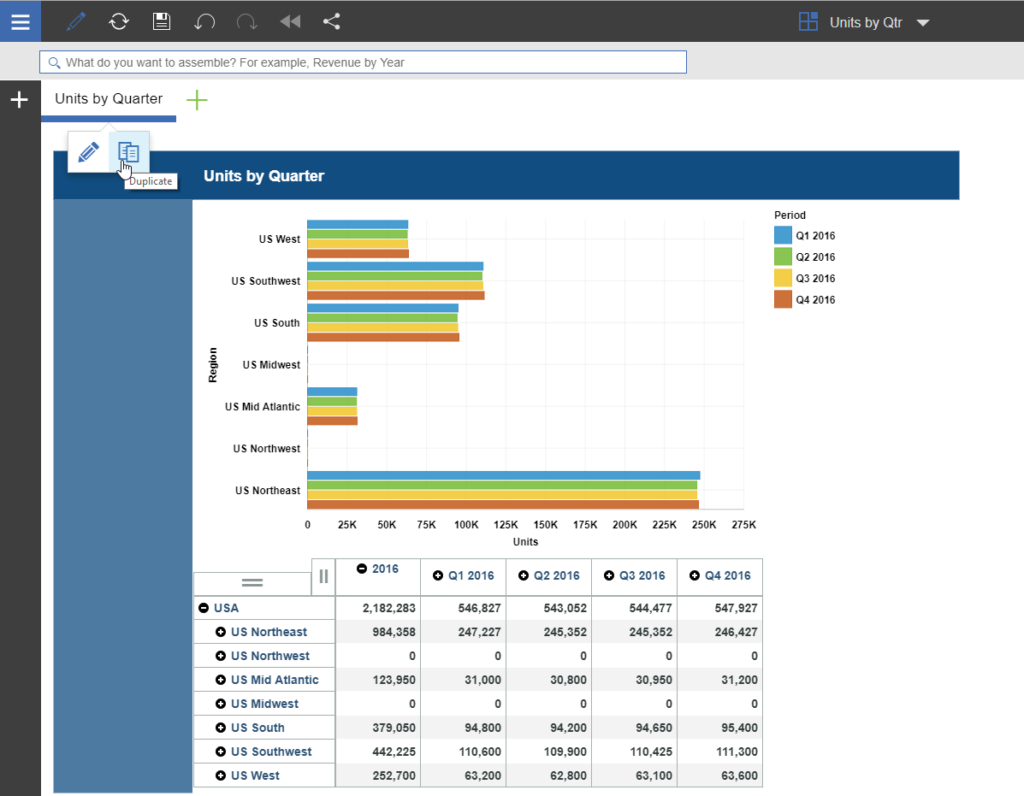
Let’s say you have a dashboard in PAW that shows ‘Units by Quarter’. It’s in a great format and you would like to see other types of information in the same format, but you don’t want to recreate the wheel for each new view. You can use the Duplicate feature to duplicate my original sheet and then change the information displayed on each sheet.
To do this, left click on the sheet tab at the top of your sheet and choose the Duplicate option. This will duplicate the sheet you have selected.
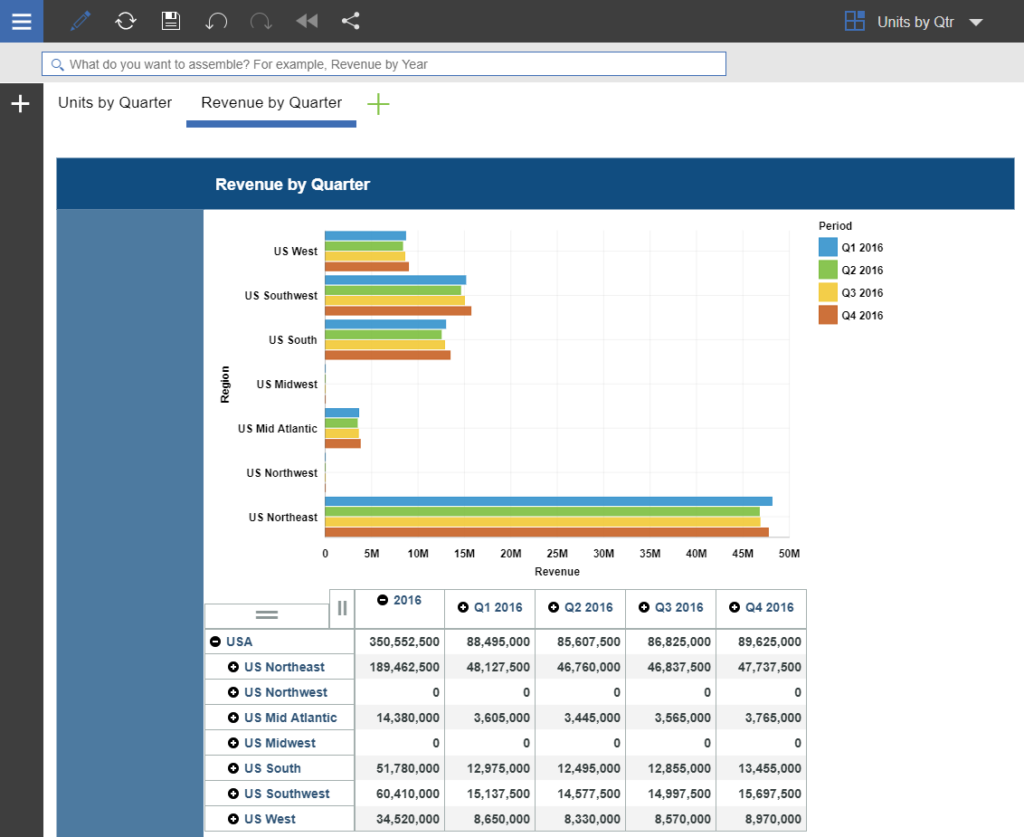
Then, with a few simple clicks, you can change your duplicated sheet to show revenue by quarter.
You can expand upon this approach by creating navigation buttons that switch between the sheets, but we’ll save that for a future post.
This simple feature can save you time with report development and help ensure all your reports with similar data have the same look and feel.
IBM Planning Analytics is full of new features and functionality. Not sure where to start? Our team here at Revelwood can help. Contact us for more information at info@revelwood.com. And stay tuned for more Planning Analytics Tips & Tricks weekly in our Knowledge Center and in upcoming newsletters!
Learn more tips on working with IBM Planning Analytics Workspace:
IBM Planning Analytics Tips & Tricks: Bookmarks in Planning Analytics Workspace
IBM Planning Analytics Tips & Tricks: Hiding Dimensions in Planning Analytics Workspace
IBM Planning Analytics Tips & Tricks: Creating Selectors in Planning Analytics Workspace