• Skip to main content
  • Skip to footer
Revelwood Logo

Revelwood

Your SUPER-powered WP Engine Site

  • Who We Are
    • About Us
      • Our Company
      • Our Team
      • Partners
    • Careers
      • Join Our Team
  • What We Do
    • Solutions
      • Workday Adaptive Planning
      • IBM Planning Analytics
      • BlackLine
    • Services
      • Implementation Services
      • Customer Care
        • Help Desk
        • System Administration as a Service
      • Training
        • Workday Adaptive Planning Training
        • IBM Planning Analytics / TM1 Training
    • Products
      • DataMaestro
      • LightSpeed
      • IBM Planning Analytics Utilities
  • How We Help
    • Use Cases
    • Client Success Stories
  • How We Think
    • Knowledge Center
    • Events
    • News
  • Contact Us

enterprise performance management

Understanding xP&A – Extended Planning & Analysis

June 7, 2021 by Lisa Minneci Leave a Comment

News & Events

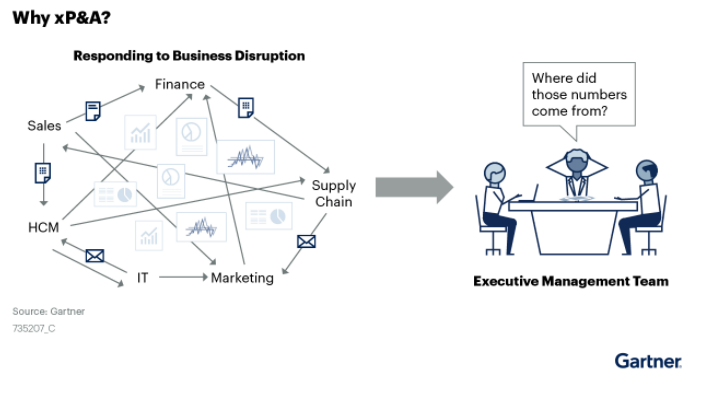
Extended Planning and Analysis (xP&A) is an enterprise planning strategy that combines and extends financial and operational planning. According to Gartner, “Taking the ‘F’ out of FP&A offers cross-organization leaders an ‘extended,’ holistic view of their company’s operations, so that they can pivot the business with greater agility and more rapidly model future business scenarios.”

The benefits of xP&A include:

  • Improved performance
  • Greater collaboration
  • Better workflow management
  • Enhanced analytics
  • Stronger governance; and more.

In a recent report, Gartner explains, “Financial planning and analysis (FP&A) efforts based on disconnected operational metrics and processes have impeded a broader approach to performance management … xP&A is a response to the challenges faced by enterprises seeking to exploit new digital business models and navigate current economic uncertainties.”

In essence, it goes that last mile from presenting a view just of finance to delivering a “holistic view of planning processes, results and progress toward fulfilling a strategy and meeting an organization’s goals.”

xP&A is building steam in leading organizations. In 2020 Gartner saw a “rapid increase in the number of client organizations seeking to integrate and link financial and operational planning processes wherever possible.” According to Gartner, more than half of the FP&A inquiries it received from January through October of that year have mentioned xP&A. The firm predicts that by 2024, 30% of FP&A implementations will be extended to support operational finance processes.

This report is a key resource for finance leaders and companies exploring xP&A. Download Innovation Insight for Extended Planning and Analysis (xP&A) to learn xP&A’s

  • Benefits and uses
  • Adoption rate
  • Risks
  • 10 major evaluation factors, and more.

xP&A can enable a view “of the current fluid, complex and highly dynamic business environment.” Companies of all sizes will benefit from xP&A solutions that keep fluctuating business plans aligned for more comprehensive and informed decision making.

Read related blog posts:

FP&A Done Right: xP&A and Modern Finance Planning

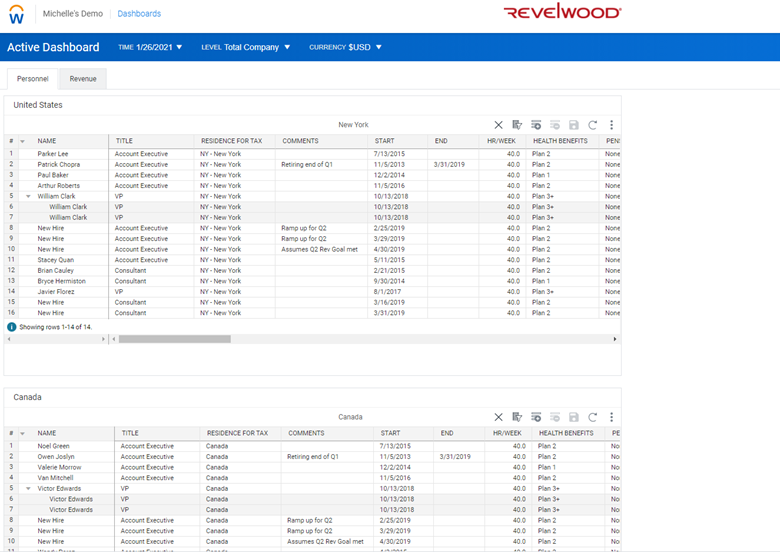
FP&A Done Right: 5 Ways Dashboards Empower the Office of Finance

FP&A Done Right: What Type of CFO are you?

Home » enterprise performance management » Page 4

Filed Under: News & Events Tagged With: agile planning, enterprise performance management, enterprise planning, extended planning & analysis, Financial Performance Management, Gartner report

IBM Planning Analytics Tips & Tricks: PAW Tab Colors

June 1, 2021 by Lee Lazarow Leave a Comment

Tips & Tricks

Have you ever created an IBM Planning Analytics Workspace (PAW) book and wanted to have more control over the look of the tabs? PAW version 57 introduced many settings that allow you to control formatting details about the tabs. These details include settings that define where the tabs appear on the screen and settings that define the colors associated with the tabs. These settings are found within the general area of the dashboard properties settings.

One setting defines where the tabs will be located on the page. Moving the tabs to the bottom will make your PAW book appear like a default excel workbook.

IBM Planning Analytics Tips & Tricks: PAW Tab Colors

Another group of settings define the colors associated with the tabs. There are three different settings to define the colors. Title color will define the color of the text within each tab, selected bar color will define the color of the line under the active tab, and fill color will define the background color of the tabs.

IBM Planning Analytics Tips & Tricks: PAW Tab Colors

In addition, there are settings which allow you to override the “all tab” settings. These settings allow you to make a single tab use different coloring.

IBM Planning Analytics Tips & Tricks: PAW Tab Colors

These new settings give you more control of the appearance of your PAW books and can be used to further customize your user experience.

IBM Planning Analytics, powered by TM1, is full of new features and functionality. Need advice? Our team here at Revelwood can help. Contact us for more information at info@revelwood.com. We post new Planning Analytics Tips & Tricks weekly in our Knowledge Center and in newsletters.

Read more IBM Planning Analytics Tips & Tricks posts:

IBM Planning Analytics Tips & Tricks: Change Element Types in PAW

IBM Planning Analytics Tips & Tricks: PAW Gridlines

IBM Planning Analytics Tips & Tricks: Control Space

Home » enterprise performance management » Page 4

Filed Under: IBM Planning Analytics Tips & Tricks Tagged With: enterprise performance management, enterprise planning, Financial Performance Management, IBM Cognos TM1, IBM Planning Analytics, IBM Planning Analytics Workspace, TM1

IBM Planning Analytics Tips & Tricks: Making Assets Accessible to Applications and Plans

May 25, 2021 by Thanh Chau Leave a Comment

When creating Applications and Plans in IBM Planning Analytics Workspace (PAW), PAW views, PAW books, and websheets can be assigned to guide each step of the business process. These objects are collectively called “Assets.”

IBM Planning Analytics Tips & Tricks: Making Assets Accessible to Applications and Plans

Although these objects are available from PAW books, they are not automatically available for use as assets in Applications and Plans. Only assets that are saved in the Shared folder are accessible by Applications and Plans. This is because Applications and Plans are designed to be collaborative, so the assets must be shared to be viewed by others.

IBM Planning Analytics Tips & Tricks: Making Assets Accessible to Applications and Plans

This design ensures that only components which should be shared are included in collaborations and will ensure that any privately created assets are not accidentally shared.

IBM Planning Analytics, powered by TM1, is full of new features and functionality. Need advice? Our team here at Revelwood can help. Contact us for more information at info@revelwood.com. We post new Planning Analytics Tips & Tricks weekly in our Knowledge Center and in newsletters.

Read more IBM Planning Analytics Tips & Tricks:

IBM Planning Analytics Tips & Tricks: Introduction to Applications and Plans

IBM Planning Analytics Tips & Tricks: Converting Existing Applications

IBM Planning Analytics Tips & Tricks: Change Element Type in PAW

Home » enterprise performance management » Page 4

Filed Under: IBM Planning Analytics Tips & Tricks Tagged With: enterprise performance management, enterprise planning, Financial Performance Management, IBM Cognos TM1, IBM Planning Analytics, IBM Planning Analytics Applications, IBM Planning Analytics Plans

FP&A Done Right: Accurate Forecasting = Insightful Decisions

May 21, 2021 by Revelwood Leave a Comment

This is a guest blog post from our partner Workday Adaptive Planning, explaining how great financial forecasts can guide business strategy.

If 2020 taught CFOs anything, it’s that they need well-executed financial forecasts and models from their FP&A team. Accurate forecasts help finance leaders make insightful, data-driven decisions, allowing their organizations to prepare for market conditions and trends, adapt to revenue and expense fluctuations, and execute strategic action plans.

So, if you’re interested in creating more accurate and reliable forecasts that can warn finance leaders when they need to make major changes, read on. You’ll learn how to create the kind of financial forecasts that guide business strategy.

Build an accurate business model

Before you can build a comprehensive financial forecast, you need to construct a well-designed business model. One way to do that is by modeling revenue. An effective revenue model should be able to answer questions like, “Which investments and actions are necessary to grow revenue by 25% next year?” Or, “If revenue remains flat, which programs should we cut to maintain profitability?” With the right model in place, you’ll have the flexibility to run scenarios and examine assumptions so you can answer these questions with confidence.

The purpose of revenue models is to forecast the sales volume and mix of products and standard service line offerings. They will vary widely based on your industry and business model. For example, a manufacturer might consider variables like capacity and utilization, while a law firm might look at client lists and billing rates. Whatever the nature of your business, the right model will help you get a better handle on revenue so you can drive your business forward.

Consider the money going out

In addition to the dollars coming in, your financial forecast will need to consider the money going out—expenses. Consider these key factors when modeling your expenses.

  • Personnel. This is likely your largest expense. If your organization is primarily salaried employees, you might forecast personnel expenses on a per-employee basis. If, however, you are a national retailer or restaurant chain with a large number of hourly employees, you may prefer to build a forecast based on work shifts or job roles.
  • Operating expenses. These are often tightly correlated with headcount. Your expense model should reflect that.
  • Cost of goods sold. You will need to forecast all costs associated with the delivery of revenue—including labor, materials, and overhead.
  • Fixed versus variable costs. Understanding what drives an expense is critical to getting the modeling right. A fixed cost (such as a data center) should be modeled in a way that it is not impacted by changes in revenue volume, while a variable cost (such as raw materials and packaging) might be modeled according to a formula (e.g., as a percentage of total revenue).
  • Overhead cost allocations. In some cases, you’ll want to trace and assign costs across segments or cost centers and possibly further to products, standard service lines, and ultimately to customers. Distributing IT expenses across multiple departments, for example, may help you understand the “fully loaded cost” of IT’s services to its various internal users. Begin by identifying “drivers” as the basis of your expense distribution. For instance, some overhead costs might be based on the number of customer orders or, for manufacturers, based on the number of material moves or machine setups. “Drivers” reflect the consumption view for how outputs consume expenses with a cause-and-effect relationship. (Activity-based costing is often used for this calculation.)

Get rolling with rolling forecasts

Once you’ve built your revenue and cost model, it’s important to define a frequency interval cadence and a calendar to recalculate the model. Financial forecasting is not a one-off exercise, but rather a practice to develop and refine over time.

By implementing a rolling financial forecast approach, you can revisit and update customer demand forecasts continuously based on actual data and performance to allow on-the-go course-correction as conditions and context change. Continuous forecasting helps you answer critical questions such as, “How are we doing against our plan?” and, “How should we adapt our plans and actions going forward?”

While some reforecasts may occur on an ad hoc basis, you should establish a consistent frequency cadence, whether semiannually, quarterly, or monthly. Each reforecast is an opportunity to assess performance and revise assumptions about the future. Your reforecasts can live alongside your original plan (and in some cases your annual fiscal budget) and represent your latest and best predictions of business performance and planned outcomes.

In some cases, you may need to generate forecasts on a much more frequent basis. Retail, hospitality, and other highly seasonal businesses may engage in daily or weekly monitoring to reflect customer shopping patterns. Other businesses may choose to do a flash weekly forecast around the product or service offering sales volume and mix or on other operational key performance indicators (KPIs) to ensure they remain on track.

Define your reporting process

Once you construct a comprehensive model of your business and incorporate your insights and assumptions into your financial forecasting process, you need to define a set of reports to be used (both internally and externally). Your reports should provide an easy-to-understand view of company health. They should include more than just a financial income statement and balance sheet view plus a pro forma net cash flow of your company’s finances. They should incorporate the monitoring of performance of both strategic KPIs and operational process-based performance indicators that you can easily share with your board of directors and management teams.

An efficient reporting process isn’t just about the reports you generate. It’s also about how you get there.

If you manage reports using only spreadsheets, then you’re familiar with the process of bringing together all your data sources, manually importing them into various spreadsheets, and emailing them around for approval. And that doesn’t even include the ad hoc requests you receive by email or from people passing you in the hallway.

The key to getting everyone the reports they need, faster and more accurately, is automation. An automated platform simplifies the gathering, reconciliation, extraction, and validation of your data. That alone can transform your reporting processes from a monthly hassle to a dynamic, ongoing influencer of organizational change.

Drive collaboration

So, you’ve automated your reporting. You’ve established a regular frequency cadence. And you’ve amazed your stakeholders with the insights you’ve shared. But if you’re still the gatekeeper of information, you may be missing out on a tremendous opportunity. When stakeholders are not directly involved in the planning process, they don’t feel a sense of ownership.

When data is accessible through self-service financial forecasting tools, people will be more likely to adopt a proactive approach to gathering critical finance data, and they’ll come to embrace your plan as their own.

Choose the right modern planning software

To help you take these steps, you’ll need the right financial forecasting tools. While Excel is where most finance teams get started, it’s not built for scale. As organizations grow and data sources multiply, organizations must turn to a cloud finance solution that can:

  • Facilitate collaboration. Get everyone in your organization involved in the planning process by giving them access to real-time data so business partners can take ownership of the numbers that they will likely be held accountable for.
  • Enable multiple what-if scenario planning. Combine high-level, top-down growth- and profit margin-based models with detailed, bottom-up personnel rosters and schedules in a single platform so you can quickly reconcile differences and address gaps.
  • Provide a single source of truth. With a core set of operational and financial data that’s common across the company, you can align the organization with the executive team’s strategy and monitor the organization’s performance in executing the strategy.
  • Automate reporting. With centralized reporting and automated data integration, you can eliminate the need to hunt for and manually aggregate data. That frees up more time to focus on analysis while providing stakeholders with the information they need to make better, faster decisions.

Financial forecasting comes down to answering a few key questions: How well can you understand your company’s position in the context of the economic environment? How much insight can you display into what’s driving opportunity and risk and causing problems? And perhaps most important of all, how ably can you communicate these insights to decision-makers throughout your organization? With the right financial forecasting tools, you can have all those answers right at your fingertips—and you can help every team member feel part of the process.

This blog post was originally published on the Workday Adaptive Planning blog.

Home » enterprise performance management » Page 4

Filed Under: FP&A Done Right Tagged With: accurate forecasting, enterprise performance management, enterprise planning, financial forecasting, Financial Performance Management, great financial forecasts, Rolling Forecasts, Workday Adaptive Planning

IBM Planning Analytics Tips & Tricks: Axis Labels

May 18, 2021 by Lee Lazarow Leave a Comment

Have you ever created a chart in IBM Planning Analytics Workspace (PAW) and wanted to change the angle which the labels appear? PAW version 57 has introduced a setting which allows you to control the labels in much greater detail.

This is done by using the Item Axis Label Orientation setting within the chart properties.

IBM Planning Analytics Tips & Tricks: Axis Labels

The results of each setting will look as follows:

Horizontal

IBM Planning Analytics Tips & Tricks: Axis Labels

Vertical

IBM Planning Analytics Tips & Tricks: Axis Labels

Rotate

IBM Planning Analytics Tips & Tricks: Axis Labels

Stagger

IBM Planning Analytics Tips & Tricks: Axis Labels

This new setting gives you more control of the appearance of your chart and can be used to further improve your user experience.

IBM Planning Analytics, powered by TM1, is full of new features and functionality. Need advice? Our team here at Revelwood can help. Contact us for more information at info@revelwood.com. We post new Planning Analytics Tips & Tricks weekly in our Knowledge Center and in newsletters.

Read more IBM Planning Analytics Tips & Tricks:

IBM Planning Analytics Tips & Tricks: The Waterfall Chart

IBM Planning Analytics Tips & Tricks: PAW Gridlines

IBM Planning Analytics Tips & Tricks: Filter in IBM Planning Analytics Workspace

Home » enterprise performance management » Page 4

Filed Under: IBM Planning Analytics Tips & Tricks Tagged With: Cognos TM1, enterprise performance management, Financial Performance Management, IBM Planning Analytics, IBM Planning Analytics Workspace, TM1

FP&A Done Right: 3 Steps for Selecting your KPIs

May 7, 2021 by Revelwood Leave a Comment

FP&A Done Right: Collaborate More When Planning

This is a guest blog post from our partner Workday Adaptive Planning, explaining how to identify the most appropriate KPIs for your organization.

Now more than ever, companies that are unable to adapt or pivot easily to adjust to changing market conditions don’t just risk falling behind. They risk their very future.

But business agility isn’t something you can implement overnight. It takes a modern, multifaceted planning environment—one that isn’t weighed down by static, legacy planning processes characterized by spreadsheets, siloed data, outdated annual plans, and stale historical snapshots.

Today, forward-thinking CFOs and their FP&A teams understand the need for nimble, data-driven financial modeling powered by cross-departmental collaboration and encompassing a panoramic view of the business—one where planning happened not just within finance but throughout the enterprise. This is the definition of modern approach to planning.

And it’s exactly what businesses need right now.

In a recent blog, we outlined the three key steps that help you lay the groundwork for a modern planning model within your own organization. To realize the full potential of that groundwork, you’ll also want to engage a series of key initiatives that will amplify your ROI and increase the velocity of business transformation. Here we look at the first of these: identifying your critical KPIs.

When everything is important, nothing is important

When everything is deemed critical, how can you be expected to prioritize? It’s impossible to effectively plan or make decisions quickly when it’s unclear what is truly driving business success. Bring those mission-critical KPIs to light, however, and you can quickly get everyone aligned around them.

But before homing in on these metrics, it’s imperative to step back, take a look at the entire organization, and recognize that performance is tracked differently in each department and team. Your core KPI model should take into account different flavors of measurement strategy across departments, recognizing the metrics that weave through multiple departments. This will help ensure that planning is collaborative and comprehensive, and that tracking progress and reporting means the same thing to all the players involved. The biggest plus in all of this? This shared measurement strategy establishes company-wide ownership and direction.

To help you isolate your organization’s KPIs (and ultimately to plan better), consider these three steps.

1. Partner with operational leaders to uncover their mission-critical KPIs.

Rather than try to guess what functional leaders care about, take the time to sit down with those key stakeholders and walk through how they define success. What does their measurement strategy look like? How do they currently track and manage their own progress? What are their data sources? Whom are their reports important to? Do they use specific language or terminology that might mean different things to people in other departments? Be as thorough as possible in fleshing out their measurement strategy and any processes they have in place to support it.

2. Keep it simple.

People can get caught up in attempting to adhere to KPIs that aren’t easily tracked or aren’t even truly indicative of performance. Avoid establishing complicated processes or adding new, hyper-focused metrics to the mix. Yes, your goal is to maintain accuracy, but you need to balance it with minimum resistance. The last thing you want is to get lost in data and complicated algorithms, forcing you in the end to have to manually follow up with gatekeepers when the time comes to pull a report.

3. Establish a reporting system.

After isolating the necessary KPIs, you’ll need to set up some workflows around reporting. What are the tools you need to access and generate a KPI report? Are these tools accessible and easy to use for all stakeholders? What are the bottlenecks, and who are the gatekeepers holding back the flow of KPI reports? Ensure your reporting operations are accessible, easy to use, and accurate enough to give you a true snapshot of your organization’s progress—without data overload.

This blog post was originally published on the Workday Adaptive Planning blog.

Home » enterprise performance management » Page 4

Filed Under: FP&A Done Right Tagged With: enterprise performance management, Financial Performance Management, FP&A done right, KPIs, Office of Finance, Workday Adaptive Planning

IBM Planning Analytics Tips & Tricks: Filter in IBM Planning Analytics Workspace

May 4, 2021 by Lee Lazarow Leave a Comment

Tips & Tricks

Have you ever wanted to show the top values within an IBM Planning Analytics Workspace (PAW) exploration?  This can be done by creating a filter within your view.

Assume we start with a view that shows 2019 operating expenses by department:

IBM Planning Analytics Tips & Tricks: Filter in PAW

We can look at the top 5 by right clicking on the column and selecting the option for “Top or bottom filter.”

IBM Planning Analytics Tips & Tricks: Filter in PAW

Once selected, we can define the parameters as Top, 5, and Members.

IBM Planning Analytics Tips & Tricks: Filter in PAW

The resulting filter will show you the 5 departments with the largest operating expense costs.

IBM Planning Analytics Tips & Tricks: Filter in PAW

This can also be reversed to show the lowest values such as profit centers with the smallest amount of revenue.

This approach will help you quickly sort your data to help analyze the information in your model.

IBM Planning Analytics, powered by TM1, is full of new features and functionality. Need advice? Our team here at Revelwood can help. Contact us for more information at info@revelwood.com. We post new Planning Analytics Tips & Tricks weekly in our Knowledge Center and in newsletters!

Read more IBM Planning Analytics Tips & Tricks:

IBM Planning Analytics Tips & Tricks: Home Page Refresh

IBM Planning Analytics Tips & Tricks: PAW Gridlines

IBM Planning Analytics Tips & Tricks: Database Administration

Home » enterprise performance management » Page 4

Filed Under: IBM Planning Analytics Tips & Tricks Tagged With: enterprise performance management, Financial Performance Management, IBM Cognos TM1, IBM PAW, IBM Planning Analytics, IBM Planning Analytics Workspace, TM1

IBM Planning Analytics Tips & Tricks: Home Page Refresh

April 27, 2021 by Dillon Rossman Leave a Comment

Did you know that the home page has received a major refresh in IBM Planning Analytics Workspace (PAW) update 57?  

Previous versions of PAW contained a lot of unused space and the look and feel changed as you moved from the home page to various pages. In PAW update 57 and beyond, the home page has been redesigned to contain a more consistent and screen friendly layout.

  • The top of the page entails a “Quick Launch” section, which includes a button for the new feature called “Applications and Plans.”
  • The bottom section of the page allows users to view any existing applications, with additional navigation for any recently used or favorited PAW items.
  • The left side of the screen contains a new toolbar which replaces the old PAW home navigation to any shared, personal, or user specific books.
IBM Planning Analytics Tips & Tricks: Home Page Refresh

This new layout is consistent throughout the PAW environment as you navigate from the home page to the various other pages, which results in a home page that utilizes space more effectively and provides a much cleaner user experience.

IBM Planning Analytics, powered by TM1, is full of new features and functionality. Need advice? Our team here at Revelwood can help. Contact us for more information at info@revelwood.com. We post new Planning Analytics Tips & Tricks weekly in our Knowledge Center and in newsletters!

Read more IBM Planning Analytics Tips & Tricks:

IBM Planning Analytics Tips & Tricks: Introduction to Apps and Plans

IBM Planning Analytics Tips & Tricks: Administration Page Layout

IBM Planning Analytics Tips & Tricks: Database Administration

Home » enterprise performance management » Page 4

Filed Under: IBM Planning Analytics Tips & Tricks Tagged With: enterprise performance management, Financial Performance Management, IBM Cognos TM1, IBM PAW, IBM Planning Analytics, IBM Planning Analytics Workspace, IBM Planning Analytics Workspace home page

Workday Adaptive Planning Tips & Tricks: Save Personal Views on Sheets with Dashboard

April 21, 2021 by Michelle Song Leave a Comment

Tips & Tricks

If you open any sheets via the Sheet tab in Workday Adaptive Planning, you can only save one view per sheet per version per user. Prior to the 2020 R2 Release, the only workaround to save the same sheet with multiple views is using EIP, Excel Interface for Planning, and open the sheet in multiple tabs or workbooks.

With the 2020 R2 Release, you now can save multiple views for the same sheet in the same tab per version in Dashboard. This function is extremely helpful to users that manage multiple departments, or anyone who wants to view the same data with different views in one tab.

In the example below, I opened the Product Revenue sheet twice in the same dashboard. The top sheet is showing the Gross Revenue account in the Product Revenue sheet for Customer 1 by Product values.  The bottom sheet is showing the same Product Revenue sheet but by Accounts.

Workday Adaptive Planning Tips & Tricks: Save Personal Views in Dashboard

Once the Display Option is applied to the sheet in Dashboard, it is automatically saved for the selected version and there is no need to click the Save icon. If the dashboard is a shared dashboard, the latest published changes will become the new view of the sheets in that dashboard.

Here is another example. The top one has a filter to show New York employees and the second one has a filter to show just the employees in Canada.

Workday Adaptive Planning Tips & Tricks: Save Personal Views in Dashboard

Visit Revelwood’s Knowledge Center for our Workday Adaptive Planning Tips & Tricks or sign up here to get our Workday Adaptive Planning Tips & Tricks delivered directly to your inbox. Not sure where to start? Our team here at Revelwood can help! Contact us info@revelwood.com for more information.

Read more Workday Adaptive Planning Tips & Tricks:

Workday Adaptive Planning Tips & Tricks: Excel Substitute

Workday Adaptive Planning Tips & Tricks: Override Formulas in Sheets

Workday Adaptive Planning Tips & Tricks: Trigger for a Cube Calculated Account

Home » enterprise performance management » Page 4

Filed Under: Workday Adaptive Planning Tips & Tricks Tagged With: Adaptive Insights, adaptive insights tips & tricks, adaptive planning dashboards, Adaptive Planning sheets, enterprise performance management, Financial Performance Management, Workday Adaptive Planning, Workday Adaptive Planning Tips & Tricks

  • « Go to Previous Page
  • Page 1
  • Page 2
  • Page 3
  • Page 4
  • Page 5
  • Page 6
  • Interim pages omitted …
  • Page 8
  • Go to Next Page »

Footer

Revelwood Overview

Revelwood helps finance organizations close, consolidate, plan, monitor and analyze business performance. As experts in solutions for the Office of Finance, we partner with best-in-breed software companies by applying best practices guidance and our pre-configured applications to help businesses achieve their full potential.

EXPERTISE

  • Workday Adaptive Planning
  • IBM Planning Analytics
  • BlackLine

ABOUT

  • Who We Are
  • What We Do
  • How We Help
  • How We Think
  • Privacy

CONNECT

World Headquarters

Florham Park, NJ | 201 984 3030

European Headquarters

London & Edinburgh | +44 (0)131 240 3866

Latin America Office

Miami, FL | 201 987 4198

Email
info@revelwood.com

Copyright © 2025 · Revelwood Inc. All rights reserved. Revelwood® and the Revelwood logo are registered marks of Revelwood Inc.