In today’s IBM Planning Analytics video tutorial, our FP&A Technical Director, Lee Lazarow, shows you how to easily create buttons for TurboIntegrator (TI) scripts. When you create buttons for your TI scripts, you simplify tasks for your end users and create a much better Planning Analytics experience for them.
In many situations you’ll have a TurboIntegrator script that you’ll want your end users to run. But you should have an easy way for them to run that script. The solution is to create a button in the Planning Analytics Workspace (PAW) environment.
Watch our video Creating Buttons for TurboIntegrator Scripts in IBM Planning Analytics to learn the steps to create a button. These include:
- Going into properties
- Turning the properties for the button target into a process
- Choosing if you want a prompt, and how you want that prompt to appear
IBM Planning Analytics, which TM1 is the engine for, is full of new features and functionality. Not sure where to start? Our team here at Revelwood can help. Contact us for more information at info@revelwood.com. And stay tuned for more Planning Analytics Tips & Tricks weekly in our Knowledge Center and in upcoming newsletters!
Want to get our Planning Analytics Tips & Tricks delivered to your inbox every Tuesday? Sign up to get our weekly email of just the week’s tip!
Watch more IBM Planning Analytics Tips & Tricks videos:
Planning Analytics Administration
Dimension Maintenance in IBM Planning Analytics
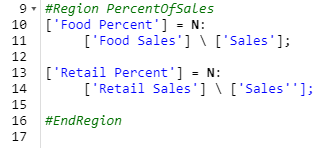
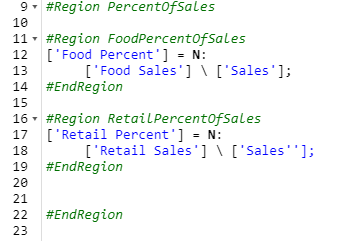
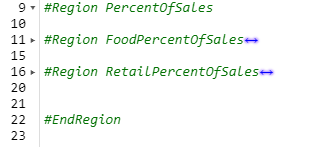
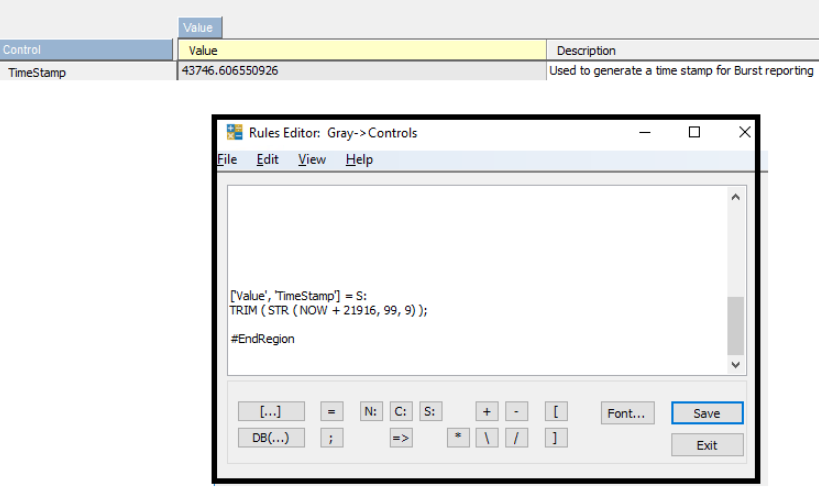
Regions with Rules in IBM Planning Analytics
Subscribe to Revelwood’s YouTube channel to watch all of our IBM Planning Analytics Tips & Tricks videos.