Have you ever wanted to define the number of working days between two calendar dates? Do you define “working days” simply as non-weekend days or do you also include holidays? Did you know that you can calculate this information using Excel’s NETWORKDAYS function?
The NETWORKDAYS function is used to determine the number of whole working days between start_date and end_date. Working days are defined as the exclusion of weekends, which in essence computes the number of Mondays through Fridays. The function also includes an optional parameter to exclude holidays and any other specific non-working days.
The syntax of the function is:
| NETWORKDAYS (start_date, end_date, [holidays]) |
- Start_date: This is required
- End_date: This is required
- Holidays: This is optional
- This consists of a range of one or more dates to be excluded from the calendar. The list entails a range of cells that contains the dates.
Note: All dates are entered in date format or in serial number format
This information can be used to help calculate any/all of the following pieces of your model:
- Benefit accruals and eligibility
- Ratios such as “Revenue per day” or “Units per day”
- Days remaining for end-of-service dates
- Anything else that requires the number of days within the formula
IBM Planning Analytics, which TM1 is the engine for, is full of new features and functionality. Not sure where to start? Our team here at Revelwood can help. Contact us for more information at info@revelwood.com. And stay tuned for more Planning Analytics Tips & Tricks weekly in our Knowledge Center and in upcoming newsletters!
Read more Excel tips in our IBM Planning Analytics Tips & Tricks series:
IBM Planning Analytics Tips & Tricks: Learn the Excel CELL Formula
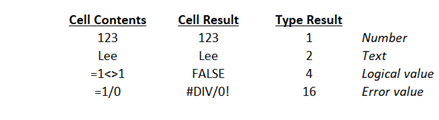
IBM Planning Analytics Tips & Tricks: Excel TYPE Function
IBM Planning Analytics Tips & Tricks: Excel Keyboard Navigation