Have you ever wanted to learn when a user last logged in to IBM Planning Analytics Workspace (PAW)? Or to generate a list of dates and times when users logged in?
IBM Planning Analytics version 87 includes a feature to easily figure out the last login time of your PAW users.
Watch this short video from Lee Lazarow, Revelwood’s Planning Analytics practice lead. You’ll see Lee demonstrate how to:
- Find ‘Users and Groups’, which contains the date and time of logins.
- Download that information into a CSV file you can save
- Learn the roles, dates and times of logins
This approach gives us the ability to quickly create a list of all of our users and for each one of our users, a date and time associated with the last login.
IBM Planning Analytics, which TM1 is the engine for, is full of new features and functionality. Not sure where to start? Our team here at Revelwood can help. Contact us for more information at info@revelwood.com. And stay tuned for more Planning Analytics Tips & Tricks weekly in our Knowledge Center and in upcoming newsletters!
Read more IBM Planning Analytics Tips & Tricks:
IBM Planning Analytics Tips & Tricks: Cell Security in Planning Analytics Workspace
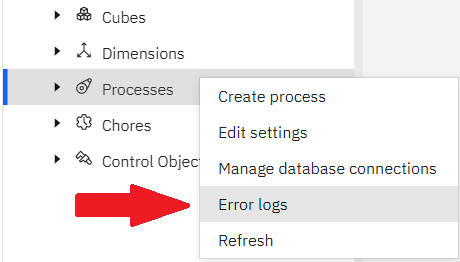
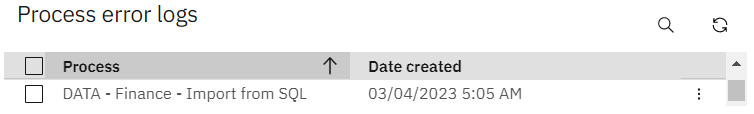
IBM Planning Analytics Tips & Tricks: Planning Analytics Workspace (PAW) Process Error Logs