Here are two more popular IBM Planning Analytics Tips & Tricks videos. Did you know we have an entire library of video tips & tricks for IBM Planning Analytics?
In this video, Revelwood’s FP&A Technology Director, Lee Lazarow, demonstrates the aggregate function. The aggregate function allows you to summarize values that cannot be added up or averaged.
Creating Multi-Level Dimensions
Watch this video to learn how to create multi-level dimensions in Planning Analytics. This approach will let you create brand-new dimensions by simply dragging a file onto the screen. You’ll learn how to create a brand-new dimension using a file created in Notepad. See how Planning Analytics recognizes that the list is more than a list of leaf levels and more than just a parent/child relationship. You’ll also learn how to map the levels and add attributes.
IBM Planning Analytics, which TM1 is the engine for, is full of new features and functionality. Not sure where to start? Our team here at Revelwood can help. Contact us for more information at info@revelwood.com. And stay tuned for more Planning Analytics Tips & Tricks weekly in our Knowledge Center and in upcoming newsletters!
Read more IBM Planning Analytics Tips & Tricks:
IBM Planning Analytics Tips & Tricks: Expanding Sections of Stacked Dimensions
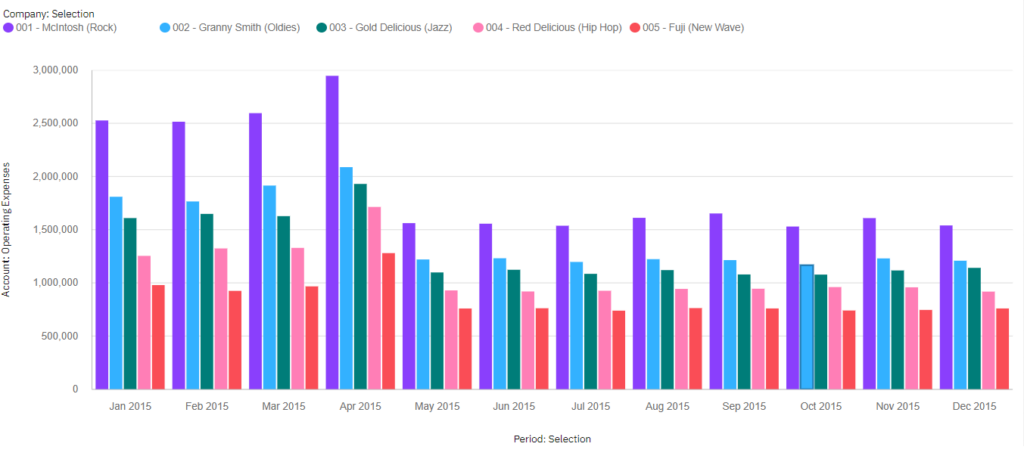
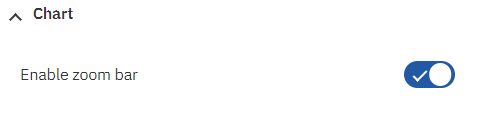
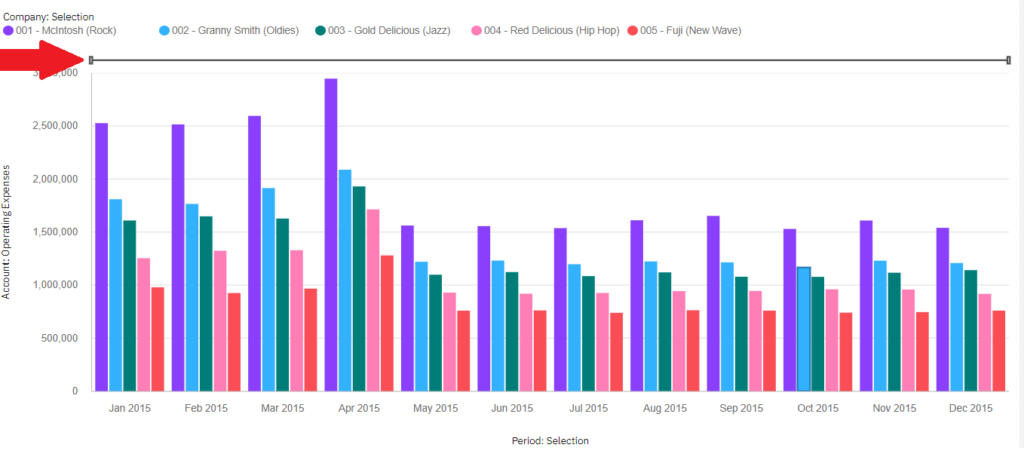
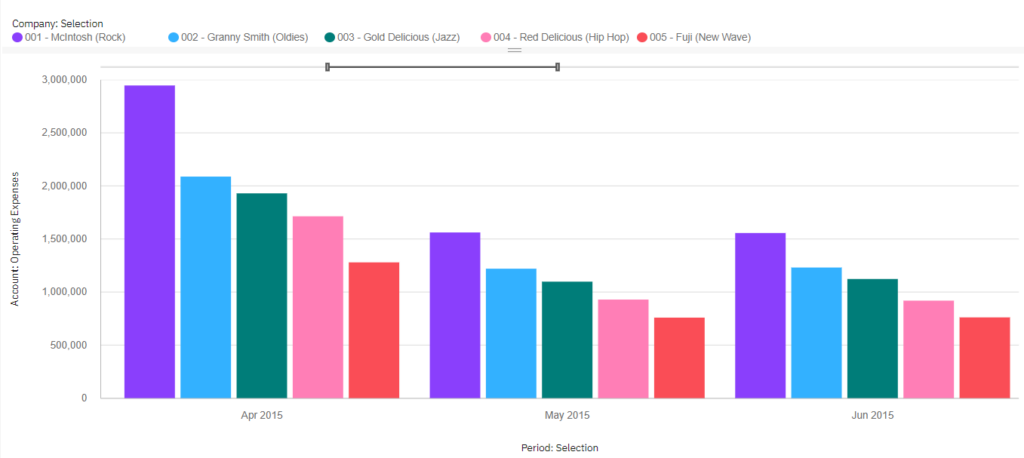
IBM Planning Analytics Tips & Tricks: Creating Charts in Planning Analytics Workspace