• Skip to main content
  • Skip to footer
Revelwood Logo

Revelwood

Your SUPER-powered WP Engine Site

  • Who We Are
    • About Us
      • Our Company
      • Our Team
      • Partners
    • Careers
      • Join Our Team
  • What We Do
    • Solutions
      • Workday Adaptive Planning
      • IBM Planning Analytics
      • BlackLine
    • Services
      • Implementation Services
      • Customer Care
        • Help Desk
        • System Administration as a Service
      • Training
        • Workday Adaptive Planning Training
        • IBM Planning Analytics / TM1 Training
    • Products
      • DataMaestro
      • LightSpeed
      • IBM Planning Analytics Utilities
  • How We Help
    • Use Cases
    • Client Success Stories
  • How We Think
    • Knowledge Center
    • Events
    • News
  • Contact Us

Nina Gordy

IBM Planning Analytics Tips & Tricks: Convert Existing View Directly to Reports

November 24, 2020 by Nina Inverso Leave a Comment

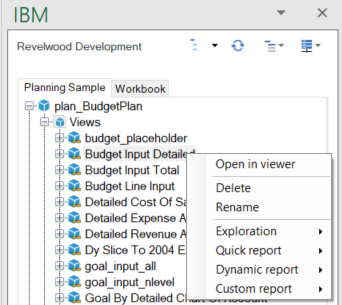
Did you know that Planning Analytics for Excel (PAx) provides the ability to convert an existing view directly to a report in Excel? Without opening the view as an Exploration, you can start building your report directly from the Task Pane.

Just right-click on the view in the Task Pane to display the available options.
IBM Planning Analytics Tips & Tricks: Convert Existing View to Reports

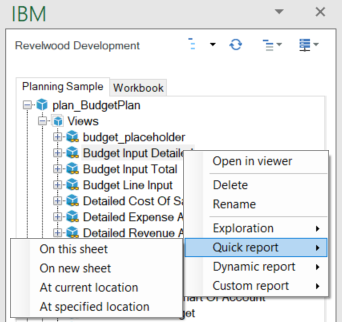
You will see the following options by hovering over the Quick report, Dynamic report, and Custom report items:
How to convert existing views into reports in Planning Analytics

In this example, each of the items does the following:

  • On this sheet: This will open the existing Planning Analytics view as a Quick report on the current Excel sheet at cell $A$1.
  • On new sheet: This will open the view as a Quick report on a new sheet at cell $A$1.
  • At current location: This will open the view as a Quick report at the cell that is currently active.
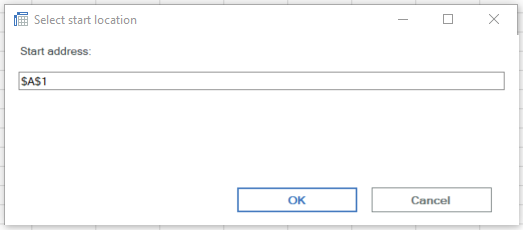
  • At specified location: This will open a pop-up window that allows you to input the cell at which you would like the Quick report to appear. You can then enter the cell address and click OK to generate the Quick report, as shown in the following image.
Learn how to convert existing views to reports in Planning Analytics

IBM Planning Analytics, which TM1 is the engine for, is full of new features and functionality. Not sure where to start? Our team here at Revelwood can help. Contact us for more information at info@revelwood.com. And stay tuned for more Planning Analytics Tips & Tricks weekly in our Knowledge Center and in upcoming newsletters! You can also sign up to get our Planning Analytics Tips & Tricks sent directly to your inbox!

Read more IBM Planning Analytics Tips & Tricks posts:

IBM Planning Analytics Tips & Tricks: PAx Task Pane Workbook Tab

IBM Planning Analytics Tips & Tricks: PAx Control Objects

IBM Planning Analytics Tips & Tricks Video: Using Drag & Drop to Change Selector Elements in PAx Reports

Home » Nina Gordy

Filed Under: IBM Planning Analytics Tips & Tricks Tagged With: Analytics, Budgeting, Budgeting Planning & Forecasting, Financial Performance Management, IBM Cognos TM1, IBM Planning Analytics, Nina Gordy, Planning & Forecasting, Planning & Reporting, Planning Analytics tips, Planning Analytics Tips & Tricks, TM1

IBM Planning Analytics Tips & Tricks: PAx Task Pane Workbook Tab

November 17, 2020 by Nina Inverso Leave a Comment

Did you know that Planning Analytics for Excel (PAx) automatically keeps track of the Planning Analytics objects you have open in an Excel workbook?

Simply click on the Workbook tab of your Task Pane to view the list of Dynamic reports, Action buttons, Explorations, and Quick reports that are currently in use.

IBM Planning Analytics Tips & Tricks: PAx Task Pane Workbook Tab
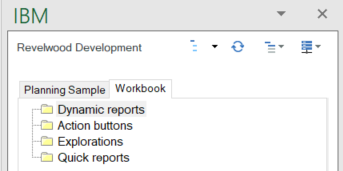
These folders will be populated as you work with your Planning Analytics environment. Whether you manually add these items to a worksheet, or they are included in an existing view or report, they will appear here.

For example, clicking the Exploration button in the PAx ribbon will create an Exploration on a new worksheet.

The PAx task pane workbook tab in IBM Planning Analytics

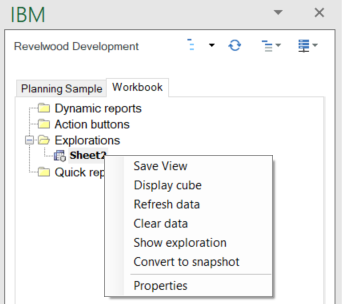
This will also add an item to the Explorations folder on the Workbook tab of the Task Pane. When you right-click on the name of the new Exploration, you will see the following options:

Learn about the PAx task pane workbook tab in IBM Planning Analytics

Similar options appear for Dynamic reports, Action buttons, and Quick reports.

IBM Planning Analytics, which TM1 is the engine for, is full of new features and functionality. Not sure where to start? Our team here at Revelwood can help. Contact us for more information at info@revelwood.com. And stay tuned for more Planning Analytics Tips & Tricks weekly in our Knowledge Center and in upcoming newsletters! You can also sign up to get our Planning Analytics Tips & Tricks sent directly to your inbox!

Read more IBM Planning Analytics Tips & Tricks:

IBM Planning Analytics Tips & Tricks: PAx Control Objects

IBM Planning Analytics Tips & Tricks: New PAx Features – Double Click

IBM Planning Analytics Tips & Tricks Video: Using Drag and Drop to Change Selector Elements in PAx Reports

Home » Nina Gordy

Filed Under: IBM Planning Analytics Tips & Tricks Tagged With: Analytics, Budgeting, Budgeting Planning & Forecasting, Financial Performance Management, IBM Cognos TM1, IBM Planning Analytics, Nina Gordy, PAx, Planning & Forecasting, Planning & Reporting, Planning Analytics for Excel, Planning Analytics Tips & Tricks, TM1

IBM Planning Analytics Tips & Tricks: Excel’s CONCAT and TEXTJOIN Functions

February 4, 2020 by Nina Inverso Leave a Comment

Tips & Tricks

Microsoft Excel has recently introduced a new version of the CONCATENATE function called CONCAT. The purpose is similar in that the new function still combines text from multiple ranges and/or strings. CONCAT will eventually replace CONCATENATE, but Microsoft has not released plans to sunset the original function to ensure compatibility with older versions of Excel.

The CONCAT function expects at least one text parameter value, with a maximum of 253 arguments. For example:

IBM Planning Analytics Tips & Tricks: CONCAT and TEXTJOIN Functions
=CONCAT(A1,B1,C1,D1,A2,B2,C2,D2)

returns “Tobeornottobe.” The new function also allows you to combine text ranges. For example:

=CONCAT(A1:D2)

returns a string consisting of the values in cells A1, B1, C1, D1, A2, B2, C2, and D2. In this case, “Tobeornottobe” will once again be returned.

Similarly, the TEXTJOIN function joins text from multiple ranges and/or strings but includes two additional parameters. These parameters allow you to specify the delimiter and determine if empty cells are ignored. For example:

=TEXTJOIN(“ ”, TRUE, A1:D2)

returns “To be or not to be,” whereas

=TEXTJOIN(“ ”, FALSE, A1:D2)

returns “To   be or not  to be.” In the last example, the spaces have been doubled wherever there are empty cells because the second parameter has been set to FALSE.

IBM Planning Analytics, which TM1 is the engine for, is full of new features and functionality. Not sure where to start? Our team here at Revelwood can help. Contact us for more information at info@revelwood.com. And stay tuned for more Planning Analytics Tips & Tricks weekly in our Knowledge Center and in upcoming newsletters!

Want to get our Planning Analytics Tips & Tricks delivered to your inbox every Tuesday? Sign up to get our weekly email of just the week’s tip!

Read related posts with Excel Tips & Tricks and using Excel with Planning Analytics:

IBM Planning Analytics Tips & Tricks: New Excel Feature – XLOOKUP

IBM Planning Analytics Tips & Tricks: Learn the Excel CELL Formula

IBM Planning Analytics Tips & Tricks: Recalculating Excel Worksheets

Home » Nina Gordy

Filed Under: IBM Planning Analytics Tips & Tricks Tagged With: Analytics, Excel, Excel tips & tricks, Financial Performance Management, IBM Cognos TM1, IBM Planning Analytics, Nina Gordy, Revelwood, TM1

IBM Planning Analytics Tips & Tricks: Excel’s IFS Function

January 21, 2020 by Nina Inverso Leave a Comment

Tips & Tricks

While the IF function has been around for a while now, IFS is new to Excel. This function checks whether one or more conditions are met and then returns the value associated with the first TRUE condition. The main objective of IFS is to simplify an expression that would have previously required multiple nested IF functions.

The general format of the IFS function is

=IFS(Condition 1, Value if Condition 1 = TRUE, Condition 2, Value if Condition 2 = TRUE, Condition 3, Value if Condition 3 = TRUE)

The function can handle up to 127 different conditions, and only the first two parameters are required.

Here is an example using a sample Excel grid:

IBM Planning Analytics Tips & Tricks: Excel's IFS function
=IFS(A1>250,A2,B1>250,B2,C1>250,C2,D1>250,D2)

will return “Green” (the value of cell C2).

In older versions of Excel, this would be written as

=IF(A1>250,A2,IF(B1>250,B2,IF(C1>250,C2,IF(D1>250,D2))))

Multiple nested IF functions would previously be used to accomplish the same result.

IBM Planning Analytics, which TM1 is the engine for, is full of new features and functionality. Not sure where to start? Our team here at Revelwood can help. Contact us for more information at info@revelwood.com. And stay tuned for more Planning Analytics Tips & Tricks weekly in our Knowledge Center and in upcoming newsletters!

Want to get our Planning Analytics Tips & Tricks delivered to your inbox every Tuesday? Sign up to get our weekly email of just the week’s tip!

Read related posts with Excel Tips & Tricks and using Excel with Planning Analytics:

IBM Planning Analytics Tips & Tricks: New Excel Feature – XLOOKUP

IBM Planning Analytics Tips & Tricks: Learn the Excel CELL Formula

IBM Planning Analytics Tips & Tricks: Recalculating Excel Worksheets

Home » Nina Gordy

Filed Under: IBM Planning Analytics Tips & Tricks Tagged With: Analytics, Excel tips & tricks, Financial Performance Management, FP&A, IBM Cognos TM1, IBM Planning Analytics, Nina Gordy, Revelwood, TM1

Footer

Revelwood Overview

Revelwood helps finance organizations close, consolidate, plan, monitor and analyze business performance. As experts in solutions for the Office of Finance, we partner with best-in-breed software companies by applying best practices guidance and our pre-configured applications to help businesses achieve their full potential.

EXPERTISE

  • Workday Adaptive Planning
  • IBM Planning Analytics
  • BlackLine

ABOUT

  • Who We Are
  • What We Do
  • How We Help
  • How We Think
  • Privacy

CONNECT

World Headquarters

Florham Park, NJ | 201 984 3030

European Headquarters

London & Edinburgh | +44 (0)131 240 3866

Latin America Office

Miami, FL | 201 987 4198

Email
info@revelwood.com

Copyright © 2025 · Revelwood Inc. All rights reserved. Revelwood® and the Revelwood logo are registered marks of Revelwood Inc.