• Skip to main content
  • Skip to footer
Revelwood Logo

Revelwood

Your SUPER-powered WP Engine Site

  • Who We Are
    • About Us
      • Our Company
      • Our Team
      • Partners
    • Careers
      • Join Our Team
  • What We Do
    • Solutions
      • Workday Adaptive Planning
      • IBM Planning Analytics
      • BlackLine
    • Services
      • Implementation Services
      • Customer Care
        • Help Desk
        • System Administration as a Service
      • Training
        • Workday Adaptive Planning Training
        • IBM Planning Analytics / TM1 Training
    • Products
      • DataMaestro
      • LightSpeed
      • IBM Planning Analytics Utilities
  • How We Help
    • Use Cases
    • Client Success Stories
  • How We Think
    • Knowledge Center
    • Events
    • News
  • Contact Us

PAx

IBM Planning Analytics Tips & Tricks: DefineCalc

January 3, 2023 by Revelwood

IBM Planning Analytics for Excel (PAx) version 80 introduced a new function called “DefineCalc.” This function allows a user to create a custom calculation using TM1/Planning Analytics data via the use of MDX.

There are a series of parameters, and the key ones are:

  • sDataSource – The connection URL used when adding your connection to Pax.  You can enter “*”if you would like the calculation to apply to all data sources.
IBM Planning Analytics Tips: DefineCalc
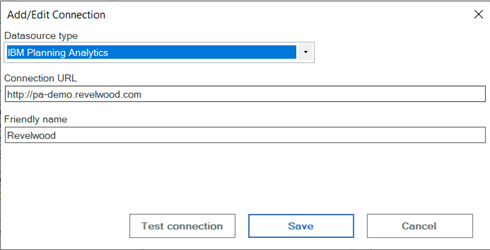
  • sServerName = Your TM1/PA server name.  You can enter “*” if you would like the calculation to apply to all servers.
  • sCalcMUN = The name for the calculation.  This will be referenced in your DBRW formulas.
  • sExpression = The MDX expression being used for the calculation (note: if you would like to remove a custom calculation then set this variable to be blank).

One use case for this function is to grab the total value of a subset. In the example below, we have a report that uses a subset called “DefineCalc Example”:

IBM Planning Analytics Tips & Tricks: DefineCalc
IBM Planning Analytics Tricks: DefineCalc

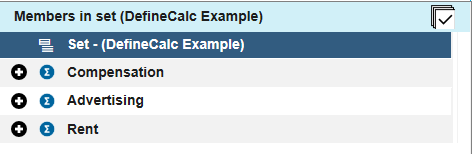
The following DefineCalc formula was used to create a total:

IBM Planning Analytics Tips & Tricks: DefineCalc

Now, let’s break this apart by each parameter:

  • sDataSource – “*”
    • This will apply to all data sources (if multiple)
  • sServerName = “*”
    • This will apply to all TM1/PA servers (if multiple)
  • sCalcMUN = “[bpmAccount].[Example 1]”
    • This first half of this value defines the bpmAccount dimension
    • The second half of this value consists of a unique name within the bpmAccount dimension
  • sExpression = “AGGREGATE(TM1SubsetToSet([bpmAccount],’DefineCalc Example’))”
    • This is an MDX expression that will give the total of the “DefineCalc Example” subset within the bpmAccount dimension

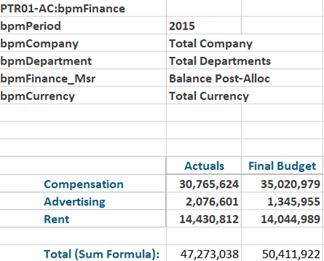
The result of this formula is populated in the cell as “Example 1.”

IBM Planning Analytics Tips & Tricks: DefineCalc

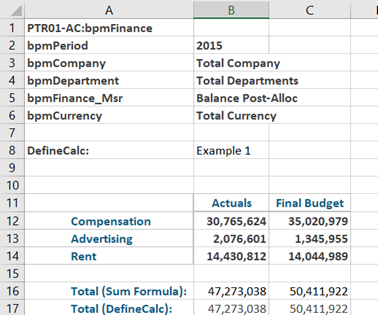
We can now reference “Example 1” within the DBRW formula as an element in the bpmAccount dimension.

IBM Planning Analytics Tips & Tricks: DefineCalc

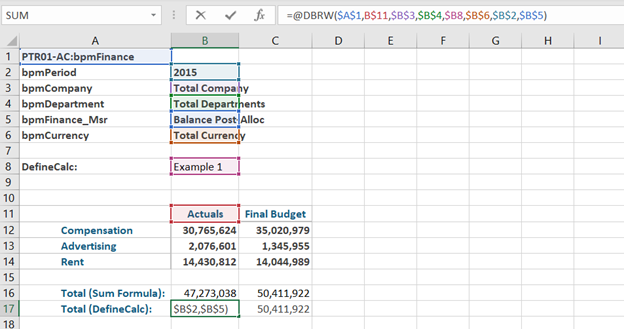
The =Sum formula of the three data rows matches the DBRW that references the DefineCalc function.

IBM Planning Analytics Tips & Tricks: DefineCalc

This shows one common use case for the new DefineCalc function, but the use MDX allows for countless other applications!

IBM Planning Analytics, which TM1 is the engine for, is full of new features and functionality. Not sure where to start? Our team here at Revelwood can help. Contact us for more information at info@revelwood.com. And stay tuned for more Planning Analytics Tips & Tricks weekly in our Knowledge Center and in upcoming newsletters!

Read more IBM Planning Analytics Tips & Tricks:

IBM Planning Analytics Tips & Tricks: MDX Syntax Explained

IBM Planning Analytics Tips & Tricks: Dynamic Subsets Based on a Cube

IBM Planning Analytics Tips & Tricks: TM1Ellist

Home » PAx

Filed Under: IBM Planning Analytics Tips & Tricks Tagged With: Budgeting Planning & Forecasting, IBM Cognos TM1, IBM Planning Analytics, IBM Planning Analytics for Excel, PAx, Planning & Forecasting

IBM Planning Analytics Tips & Tricks: PAx Task Pane Workbook Tab

November 17, 2020 by Nina Inverso Leave a Comment

Did you know that Planning Analytics for Excel (PAx) automatically keeps track of the Planning Analytics objects you have open in an Excel workbook?

Simply click on the Workbook tab of your Task Pane to view the list of Dynamic reports, Action buttons, Explorations, and Quick reports that are currently in use.

IBM Planning Analytics Tips & Tricks: PAx Task Pane Workbook Tab

These folders will be populated as you work with your Planning Analytics environment. Whether you manually add these items to a worksheet, or they are included in an existing view or report, they will appear here.

For example, clicking the Exploration button in the PAx ribbon will create an Exploration on a new worksheet.

The PAx task pane workbook tab in IBM Planning Analytics

This will also add an item to the Explorations folder on the Workbook tab of the Task Pane. When you right-click on the name of the new Exploration, you will see the following options:

Learn about the PAx task pane workbook tab in IBM Planning Analytics

Similar options appear for Dynamic reports, Action buttons, and Quick reports.

IBM Planning Analytics, which TM1 is the engine for, is full of new features and functionality. Not sure where to start? Our team here at Revelwood can help. Contact us for more information at info@revelwood.com. And stay tuned for more Planning Analytics Tips & Tricks weekly in our Knowledge Center and in upcoming newsletters! You can also sign up to get our Planning Analytics Tips & Tricks sent directly to your inbox!

Read more IBM Planning Analytics Tips & Tricks:

IBM Planning Analytics Tips & Tricks: PAx Control Objects

IBM Planning Analytics Tips & Tricks: New PAx Features – Double Click

IBM Planning Analytics Tips & Tricks Video: Using Drag and Drop to Change Selector Elements in PAx Reports

Home » PAx

Filed Under: IBM Planning Analytics Tips & Tricks Tagged With: Analytics, Budgeting, Budgeting Planning & Forecasting, Financial Performance Management, IBM Cognos TM1, IBM Planning Analytics, Nina Gordy, PAx, Planning & Forecasting, Planning & Reporting, Planning Analytics for Excel, Planning Analytics Tips & Tricks, TM1

IBM Planning Analytics Tips & Tricks: PAx Control Objects

November 12, 2019 by Lee Lazarow Leave a Comment

Tips & Tricks

IBM Planning Analytics uses cubes to store metadata information such as security and attribute information. These automatically generated cubes are called control cubes (which I sometimes call “squiggle cubes”) and begin with a prefix of a right curly brace.

Server Explorer used a toggle approach within the View menu to allow users to either view or hide these cubes. Planning Analytics for Excel (PAx) also includes a toggle approach that can be used via the following steps:

1) Ensure that the task pane is showing by selecting the icon within the IBM Planning Analytics ribbon

IBM Planning Analytics Tips & Tricks: PAX Control Objects

2) Click on the icon for “show and hide”

Understanding PAx Control Objects - IBM Planning Analytics Tips & Tricks

3) Select the option for “show control objects”

How to use PAx Control Objects - IBM Planning Analytics Tips & Tricks

Once selected, the list of cubes will expand and will display the control cubes. This list can be controlled via cube security to limit which control cubes can be seen by the user.

IBM Planning Analytics, which TM1 is the engine for, is full of new features and functionality. Not sure where to start? Our team here at Revelwood can help. Contact us for more information at info@revelwood.com. And stay tuned for more Planning Analytics Tips & Tricks weekly in our Knowledge Center and in upcoming newsletters!

Read more IBM Planning Analytics Tips & Tricks:

IBM Planning Analytics Tips & Tricks: Troubleshooting Planning Analytics for Excel (PAx)

IBM Planning Analytics Tips & Tricks: The Ranked Report

IBM Planning Analytics Tips & Tricks: The Replace and Close Feature in PAx

Home » PAx

Filed Under: IBM Planning Analytics Tips & Tricks Tagged With: Analytics, Budgeting, Budgeting Planning & Forecasting, Financial Performance Management, IBM Cognos TM1, IBM Planning Analytics, PAx, Planning & Forecasting, Planning & Reporting, Planning Analytics for Excel, TM1

Revelwood Launches Report Conversion Service for Migrating Excel & TM1 Web Reports to PAx

October 17, 2019 by John Pra Sisto Leave a Comment

News & Events

Revelwood has launched a new Report Conversion service to help TM1 users to migrate their Excel and TM1 Web (Websheets) reports to Planning Analytics for Excel (PAx). Our service also helps TM1 users recreate their existing Excel or TM1 Web reports in PAx.

As with all the aspects of migrating from TM1 to Planning Analytics, there is a significant benefit to migrating existing reports to the new platform. The biggest of these benefits is improving performance. When you migrate to, or recreate these reports in PAx, you’ll also be able to take advantage of both Active Forms and MDX to make the new versions of your reports truly dynamic.

Migrating reports can be time-consuming. But it also presents the opportunity to review your report library and assess which reports you actually need and which ones you can retire. Rather than get overwhelmed with the prospect of assessing and moving your reports, let us help you.

Revelwood’s report conversion service consists of:

  • Conversion – We’ll convert your Excel reports from TM1 Perspectives to PAx. We’ll work with you to make sure the new reports look the way you want them to look, execute correctly, and render as Websheets where appropriate. We’ll use our own tools we’ve developed, specifically designed to streamline the conversion process. We’ll also make sure you have easy access to all the reports in your report library.
  • Optimization – Over time reports tend to become laden with too much information, or, on the flip slide, missing data elements. They also end up with hidden hard-coded values, errors, and performance issues. Our Report Conversion service includes automating and optimizing for accuracy and improved performance. You’ll save time and eliminate errors in your ongoing reporting process.
  • Rationalization – We’ll work with you to rationalize your reporting strategy. Together we’ll determine which reports you need and which reports can be combined to save time and effort. We’ll decide which reports need to be rendered in Planning Analytics Workspace (PAW) and accessed via a browser, instead of in Excel. We’ll also help you determine if Quick Reports and/or Explorations should be used instead of the traditional DBRW-style reports from TM1.
  • Education – We’ll make you self-sufficient in creating and maintaining PAx reports going forward! Our team will train you on PAx, with an emphasis on how to build well-designed, dynamic financial reports that leverage the best of both Planning Analytics and Excel.

Migrating your existing reports to Planning Analytics presents a unique opportunity to assess your reporting strategy, optimize and streamline your reports. Don’t just migrate your reports wholesale. Let us help you convert and make the most out of your reports.

Questions? Just drop me an email!

Home » PAx

Filed Under: News & Events Tagged With: Financial Performance Management, IBM Cognos TM1, IBM Planning Analytics, PAW, PAx, PAx reports, Planning Analytics for Excel, Planning Analytics Workspace, report conversion services, Revelwood, TM1, TM1 Perspectives, TM1 web

IBM Planning Analytics Tips & Tricks- Creating Dynamic, Attractive Views and Dashboards

November 1, 2017 by Nina Inverso Leave a Comment

Tips & Tricks

Did you know IBM Planning Analytics Workspace (PAW) allows you to create dynamic, attractive views and dashboards? With the vast number of stylistic options available, there are a few key tips that can be used to create a fluid user experience.

Use the “Caption” alias for dimension names.

The “Caption” alias can be modified for each dimension in the }DimensionAttributes cube. Once you’ve assigned a user-friendly name, or caption, to a dimension, this value will appear in your Planning Analytics Books in place of the dimension’s original name. The caption can then be updated at any point.

Use selector elements to ensure a uniform user experience.

Create selector elements when all users may not have access to all elements in the dimension. For instance, create an element in the department dimension called “Select a Department” and give everyone security to this new element. You can then set the new element as the starting point. When users open the dashboard, they will not see any data and will then be able to select elements based on their security rights.

Synchronize dimensions throughout the Book and individual Sheets.

Once you’ve created a new Book, you can synchronize the data using the “Synchronization scope” option in the Properties dropdown. The Properties button is located in the upper right-hand corner of the screen when you are in edit mode (image below). You have the choice to synchronize across the Book or Sheet, meaning an element selection can be carried across multiple visualizations to allow for uninterrupted data access.

For more information on Planning Analytics Workspace, refer to the IBM Planning Analytics 2.0.0 documentation.

IBM Planning Analytics is full of new features and functionality. Not sure where to start? Our team here at Revelwood can help. Contact us for more information at info@revelwood.com. And stay tuned for more Planning Analytics Tips & Tricks weekly in our Knowledge Center and in upcoming newsletters!

Home » PAx

Filed Under: IBM Planning Analytics Tips & Tricks Tagged With: Budgeting, Financial Performance Management, IBM Planning Analytics, PAx, Planning & Reporting, TM1

Footer

Revelwood Overview

Revelwood helps finance organizations close, consolidate, plan, monitor and analyze business performance. As experts in solutions for the Office of Finance, we partner with best-in-breed software companies by applying best practices guidance and our pre-configured applications to help businesses achieve their full potential.

EXPERTISE

  • Workday Adaptive Planning
  • IBM Planning Analytics
  • BlackLine

ABOUT

  • Who We Are
  • What We Do
  • How We Help
  • How We Think
  • Privacy

CONNECT

World Headquarters

Florham Park, NJ | 201 984 3030

European Headquarters

London & Edinburgh | +44 (0)131 240 3866

Latin America Office

Miami, FL | 201 987 4198

Email
info@revelwood.com

Copyright © 2025 · Revelwood Inc. All rights reserved. Revelwood® and the Revelwood logo are registered marks of Revelwood Inc.