When potential clients are evaluating IBM Planning Analytics as a budgeting, planning and reporting solution, they often ask us for its ROI. It’s not a simple question to answer. Every organization’s business situation, and needs are unique to them. The corresponding implementation is as well. As a result, there’s really no universal ROI for any given software solution.
A Forrester report helps provides some related information for businesses looking at Planning Analytics. IBM and Forrester recently came out with The Total Economic Impact™ of IBM Planning Analytics. The analyst firm used its Total Economic Impact (TEI) framework and methodology for the report, which serves “to provide a complete picture of the total economic impact of purchase decisions.” The findings are based on interviews with four customers with significant experience with IBM Planning Analytics, and with IBM executive and Forrester analysts.
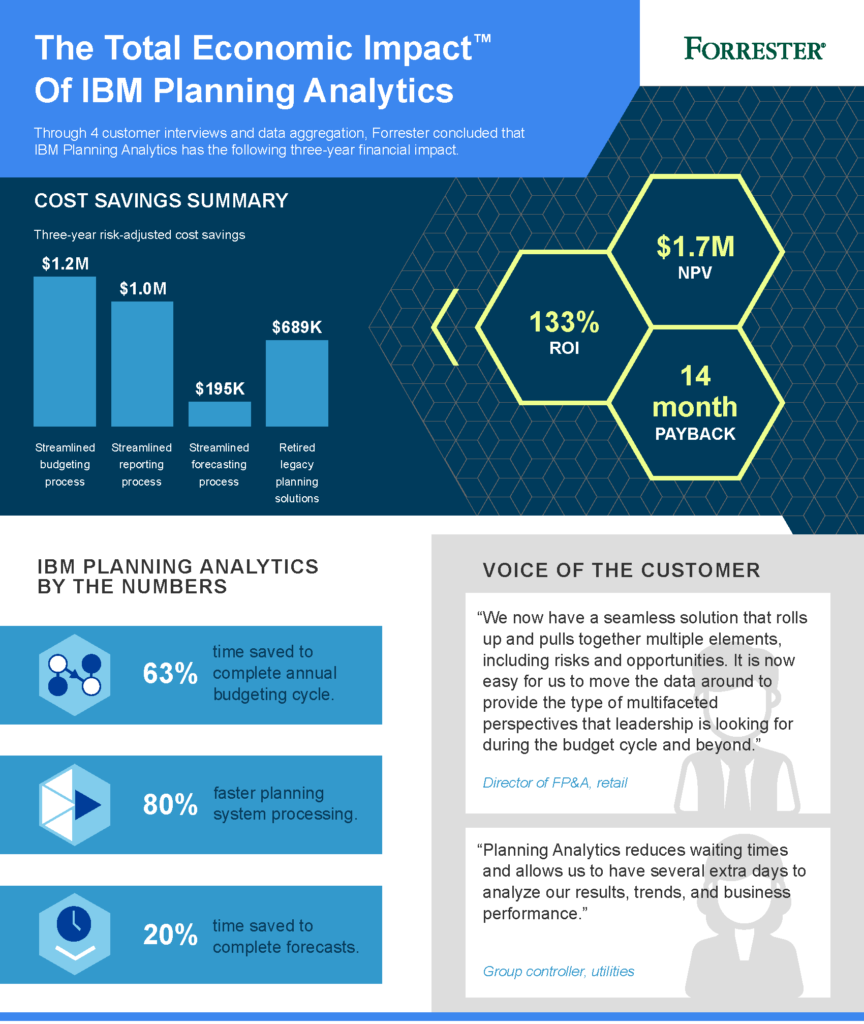
Based on the report, the total economic impact of Planning Analytics include:
- 63% less time spent to complete the annual budgeting cycle
- 80% faster processing planning data
- 70% fewer labor hours required to complete forecasting cycles
Learn more about the key findings in the report and the benefits of Planning Analytics.
Read additional analyst reports that cover IBM Planning Analytics:
Revelwood Partners Adaptive Insights and IBM Earn High Ratings in BPM Partners’ BPM Pulse Survey
Excel Users Embrace IBM Planning Analytics
Independent Survey Ranks IBM Planning Analytics Against Competing Products