• Skip to main content
  • Skip to footer
Revelwood Logo

Revelwood

Your SUPER-powered WP Engine Site

  • Who We Are
    • About Us
      • Our Company
      • Our Team
      • Partners
    • Careers
      • Join Our Team
  • What We Do
    • Solutions
      • Workday Adaptive Planning
      • IBM Planning Analytics
      • BlackLine
    • Services
      • Implementation Services
      • Customer Care
        • Help Desk
        • System Administration as a Service
      • Training
        • Workday Adaptive Planning Training
        • IBM Planning Analytics / TM1 Training
    • Products
      • DataMaestro
      • LightSpeed
      • IBM Planning Analytics Utilities
  • How We Help
    • Use Cases
    • Client Success Stories
  • How We Think
    • Knowledge Center
    • Events
    • News
  • Contact Us

Analytics

IBM Planning Analytics Tips & Tricks: Performance Monitoring, Part 1

March 6, 2018 by Nina Inverso Leave a Comment

Tips & Tricks

Did you know that server resources are vitally important to maintaining a working TM1 system? In this two-part blog series, I’ll review methods for monitoring the resources available on your server and the ways in which you can address most issues that may arise.

The three main resources you’re going to want to monitor are CPU, RAM, and disk:

  • CPU (Central Processing Unit) – Often referred to as the brains of the computer, the CPU is where most calculations and operations take place.
  • RAM (Random Access Memory) – Sometimes compared to a person’s short-term memory, RAM is a type of memory that can be accessed quickly and efficiently.
  • Disk – Sometimes compared to a person’s long-term memory, the disk is where data is stored in your computer permanently (or until it’s deleted).

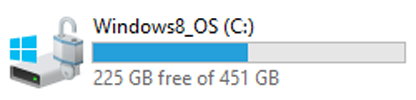
The first, and easiest, resource you can monitor is a server’s available disk space. To view the available disk space on a server, follow these steps:

  1. Open Windows File Explorer
  2. Select This PC in the left paneIBM Planning Analytics Tips & Tricks: Monitoring Server Resources
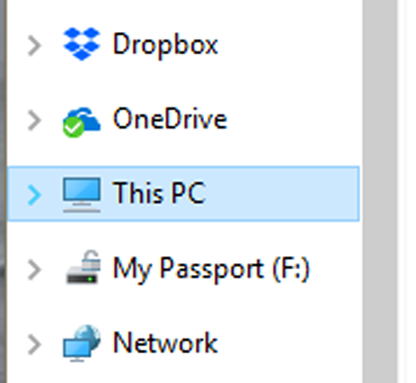
  3. Check each drive for space available

Note: The free space available on each drive is displayed next to or beneath it.

Learn performance monitoring for IBM Planning Analytics

In addition, the following steps can be taken to monitor the server’s CPU, RAM, and disk usage:
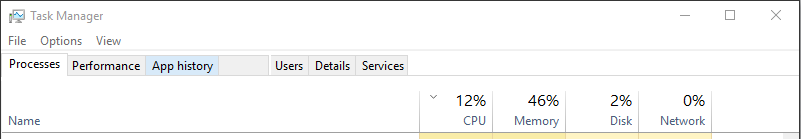
  1. Open Task Manager
  2. View CPU, RAM, and disk usages by processes in the CPU, Memory, and Disk columns, respectivelyLearn how to monitor server resources in IBM Planning Analytics
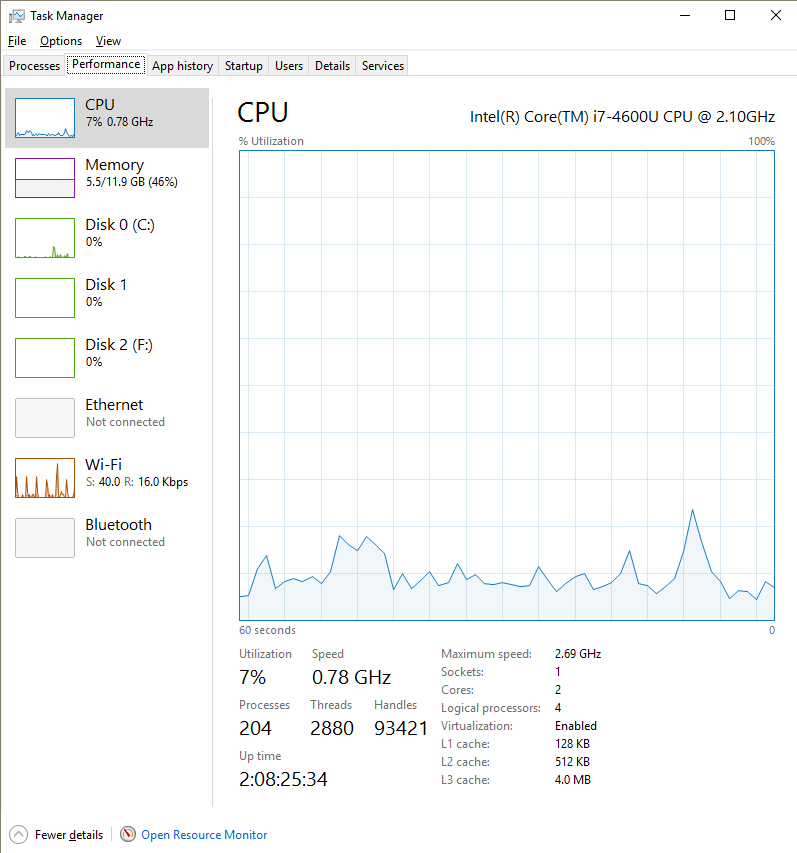
  3. Select the Performance tab
  4. View total usages under the CPU, Memory, and Disk options
  5. Select the CPU, Memory, and Disk option to view more detailsTips for monitoring server resources in IBM Planning Analytics
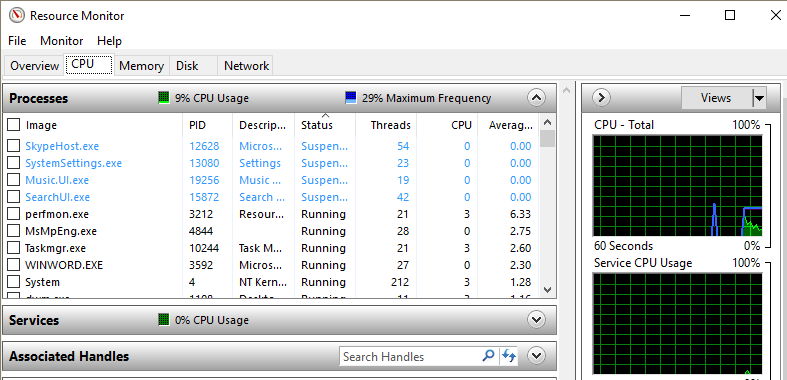
  6. Select Open Resource Monitor at the bottom of the window
  7. View details regarding CPU, RAM, and disk usages on the CPU, Memory, and Disk tabs, respectively
Performance monitoring in IBM Planning Analytics

In the next post, I will review some ways to address any resource issues you may see.

IBM Planning Analytics (built on the TM1 engine) is full of new features and functionality. Not sure where to start? Our team here at Revelwood can help. Contact us for more information at info@revelwood.com.  And stay tuned for more Planning Analytics Tips & Tricks weekly in our Knowledge Center and in upcoming newsletters!

Read the second post in this series, IBM Planning Analytics Tips & Tricks: Performance Monitoring, Part 2

Home » Analytics » Page 22

Filed Under: IBM Planning Analytics Tips & Tricks Tagged With: Analytics, Budgeting, Financial Performance Management, IBM Planning Analytics, Planning & Reporting, TM1

IBM Planning Analytics Tips & Tricks: New Configuration Setting for Dates

February 27, 2018 by Revelwood Leave a Comment

Tips & Tricks

This is a guest post from Revelwood’s Shane Bethea.

Did you know IBM Planning Analytics 2.0 has a new feature that makes it easier to manipulate dates?

Previously, when manipulating dates in IBM Planning Analytics / TM1, I always had to reach for a crumpled up, barely legible sticky note I have laying on my desk that has the number 21916 written on it.  This is because TM1 rules and TI functions do not calculate serial date numbers from the same starting point as Microsoft Excel.  The starting point for time in TM1 is 1/1/1960 whereas the starting point for time in Excel is 1/1/1900.  The difference between 1/1/1900 and 1/1/1960 is, you guessed it, 21916 days.  Date functions in TM1 rules and TI have to take this into account by adding or subtracting 21916 when manipulating dates.

Wouldn’t it be nice to eliminate that obscure number every time you work with dates in TM1 / Planning Analytics?  Well, IBM has introduced a configuration setting in Planning Analytics 2.0 called ‘UseExcelSerialDate’ to remove the confusion. When this new configuration setting is set to T (true), TM1 / Planning Analytics rules and TI functions use a starting point of 1/1/1900.  This configuration setting can be turned on by adding the parameter to the tm1s.cfg file for your TM1 database.  The default setting is F (false).

Let’s take a look at an example. In TM1 version 10.2.2 and earlier, the date 5/31/2018 is represented by the number 21335 because 5/31/2018 is 21334 days after 1/1/1960.  However, in Microsoft Excel, the date 5/31/2018 is represented by the number 43251.  This is because 5/31/2018 is 43250 days after 1/1/1900.

Below is a simple cube rule to calculate the serial data number based on user entry of a date.  Because the UseExcelSerialDate configuration setting is false by default, I have to add 21916 to ensure that TM1 / Planning Analytics and Excel dates match.  See below where Index 001 uses only the DAYNO() function and Index 002 uses the DAYNO() function plus 21916.

IBM Planning Analytics new feature for manipulating dates
Learn about IBM Planning Analytics new feature for manipulating dates

Now, if I set the UseExcelSerialDate configuration setting to T, I can modify the rule to not include the addition of the 21916 and my Serial Date measure results in the value of 43251, which matches Excel serial dates.

Read how to use IBM Planning Analytics new feature for manipulating dates
Understanding how to use IBM Planning Analytics new feature for manipulating dates

This new configuration setting enables my TM1 functions to calculate on the same scale as Excel and removes any confusion about dates that may have existed in the past.  Best of all, I can get rid of that old sticky note.

IBM Planning Analytics  is full of new features and functionality. Not sure where to start? Our team here at Revelwood can help. Contact us for more information at info@revelwood.com. And stay tuned for more Planning Analytics Tips & Tricks weekly in our Knowledge Center and in upcoming newsletters!

Read more blog posts with tips & tricks on IBM Planning Analytics and TM1:

IBM Planning Analytics Tips & Tricks: The Ranked Report

IBM Planning Analytics Tips & Tricks: Using MDX to Compare Dimension Hierarchies

IBM Planning Analytics Tips & Tricks: New Parameters for Turbo Integrator

Home » Analytics » Page 22

Filed Under: IBM Planning Analytics Tips & Tricks Tagged With: Analytics, Budgeting, Financial Performance Management, IBM Planning Analytics, Planning & Reporting, TM1

Turn Forecasting into a Competitive Advantage

January 2, 2018 by Lisa Minneci Leave a Comment

News & Events

Have you thought about how to turn financial forecasting into a competitive advantage? In today’s disruptive, high-stakes economy, maximizing any and every competitive advantage can mean the difference between just surviving versus thriving. And if you did turn your standard forecasting activities into a competitive advantage, what would that mean for you and your team in the Office of Finance?

A new report from the Financial Executives Research Foundation (FERF) makes a strong argument for how and why forecasting can become a much more strategic activity for your organization. According to FERF, “More effective forecasting and a deeper understanding of how markets are likely to evolve can provide competitive advantage by improving a company’s agility and its ability to enhance products, target customers more effectively or gain other operational insights.”

Here are some examples of how you can turn forecasting into a competitive advantage:

  • Use demand planning to anticipate the likely effects of variables such as marketing campaigns, market conditions in a given region, price discounts and more.
  • Generate stronger insights from a greater volume and variety of data to replace gut instinct and ensure more confidence in the numbers and advice coming from the Office of Finance
  • Develop insights into how markets are likely to evolve in order to enhance product offerings and target customers more effectively
  • Use scenario modeling to explore potential outcomes and identify the activities that have the greatest effect on your business
  • Analyze accounts receivable to create profiles that rank customers in the likelihood of them paying invoices promptly
  • Apply point-of-sale data to optimize inventory levels to adjust purchases from suppliers

As the report states, “the growing use of analytics to enhance forecasting represents the latest development in the increasing recognition that an organization’s data has evolved from a byproduct of its interactions with customers and stakeholders into a powerful source of organizational value.”

Home » Analytics » Page 22

Filed Under: News & Events Tagged With: Advanced Analytics, Analytics, Budgeting, Data Science, Financial Performance Management, Predictive Analytics

Cognitive Computing Adopters are More Profitable & Innovative than Their Peers

November 8, 2017 by Lisa Minneci Leave a Comment

News & Events

According to a report from the IBM Institute for Business Value, 89% of cognitive computing adopters are more profitable and more innovative than their industry peers. That’s an incredibly strong argument for embracing – or if you are not yet ready, exploring – cognitive computing. Think of the impact greater profits and innovation could make on your organization. Could it position you to be a disruptor in your industry? Could you finally beat the competitor with whom you’ve been neck-and-neck with for years? Would it enable you to expand into new markets? Or give back more to your employees?

In this report, Analytics: Dawn of the Cognitive Era, IBM found that 74% of organizations “are pervasively using at least one type of prescriptive analysis. And once a majority of organizations achieve a widespread use of an analytic level, the competitive advantage evolves to the next level of analytic maturity. Competitive differentiation is now greater for those using the fifth level: cognitive.

Interestingly, this research found that cognitive computing is being used in each of the 19 industry groups surveyed, and across all geographic regions. Those using cognitive are outperforming their peers in a number of ways, including:

  • Revenue creation
  • Effectiveness
  • Profitability
  • Innovation

They are also using cognitive systems in a number of different ways, such as for knowledge distribution, research and product development, external constituent and customer management, and sales and service activities. The survey found that most of these organizations, however, started their cognitive journey with a specific use case.

To achieve success with cognitive computing, organizations need more than just technology, data and analytics. According to the report, entry into the cognitive era also “requires a corporate culture and mindset ready to engage with the science of data and strong governance to create agility and speed … a cognitive environment is an analytic evolution, building on the analytics of today to create the marketplace of tomorrow.”

Download this report and you’ll learn how to:

  • Establish an organization cornerstone for cognitive
  • Build a solid cognitive data foundation, and
  • Focus on the skills of the future

Whether you are ready to evolve your use of analytics into the cognitive era or are just starting your research on cognitive, provides practical steps (as well as mini case studies) on how to begin your journey into cognitive computing.

Read more blog posts on cognitive computing:

What the Heck is Cognitive Computing?

New Research: Cognitive Computing will be a Game-Changer for Marketing

Embracing Cognitive Computing

Home » Analytics » Page 22

Filed Under: News & Events Tagged With: Advanced Analytics, Analytics, Data Science, Predictive Analytics

Complex Modeling in IBM Cognos TM1 at New York Blood Center

September 22, 2017 by Lisa Minneci Leave a Comment

Success Stories

If you are looking for a great example of complex modeling in IBM Cognos TM1, look no further than the case study on New York Blood Center. Imagine having untold numbers of separate models in disparate systems – such as Excel and Access – all built for a single purpose, but that did not talk to each other? How could you answer simple questions about the data, let alone complex questions?

That’s the situation that New York Blood Center (NYBC) faced. NYBC is one of the largest independent, community-based blood centers in the country. In 2012 NYBC brought in a new CFO, Beth Gibson, who, in turn, brought in a new director of financial transformation a year later. Diane Arritt, who took on the role of Director of Finance Transformation, was charged with taking the old, manual, largely spreadsheet-based financial infrastructure and move to a single, sophisticated system.

Today, NYBC has a core set of TM1 models to store GL, billing, payroll, AR and AP data. From there, each model was then built out to support NYBC’s reporting and planning needs. Then we created a series of allocation models to allow for the proper distribution of overhead costs across all of NYBC’s reporting lines of businesses. We also created allocation models to allow NYBC to report on costs per unit related to collecting and distributing the blood products.

The TM1 system enables the organization to plan, model, allocate, report and manage the revenue and expense data faster, in more detail and more accurately than ever before. The overall impact of the new financial system is much larger than just the time savings, which is significant. With TM1, changes that previously took more than a day can be done in just minutes.

“Previously, it would have taken us at least three months to map general ledger accounts and accounting units into our processes to do the appropriate reporting for an acquisition,” said Diane Arritt, Director of Finance Transformation. “Now our team was able to produce combined financial results for management the first month we acquired the Community Blood Center of Greater Kansas City. We simply could not have done that without the hierarchies and flexibility of TM1.”

Read the full case study on how New York Blood Center transformed its financial operations with IBM Cognos TM1 by downloading it here.

Read more Revelwood client success stories:

Rayonier Makes Better use of Resources with IBM Cognos TM1

Home » Analytics » Page 22

Filed Under: Success Stories Tagged With: Analytics, Budgeting, Financial Performance Management, Implementation Services, Modeling, Planning & Reporting, TM1

Survey Finds the Office of Finance to Double its Adoption of Analytics

September 13, 2017 by Brian Combs Leave a Comment

FP&A Done Right

The IBM Center for Applied Insights surveyed 337 senior finance leaders on their adoption of analytics. It may not be surprising, but the survey found that organizations plan to double adoption of analytics in all areas of finance in the next two years. A report citing the study answers the why: “As one executive admitted, ‘Advanced analytics gives me answers to questions I didn’t even know I had.’”

Interestingly, 28 percent of the survey respondents were categorized as the “most effective” finance leaders. They were more effective than their peers across these ten finance-focused activities:

  1. Cash forecasting
  2. Expense management
  3. Finance process optimization
  4. Financial planning
  5. Management reporting
  6. Mergers and acquisitions
  7. Order-to-cash
  8. Procurement
  9. Profitability and margin analysis
  10. Revenue forecasting

The same survey found that 9 out of 10 finance organizations have implemented analytics solutions to support their financial processes in the last five years and even more are expecting to implement analytics in the next five years. One of the challenges, though, is that organizations are still primarily using analytics to look backward rather than to predict business outcomes. That ability to look forward is increasingly becoming a competitive differentiator for organizations in nearly all industries.

Even finance organizations that are deep into analytics are still finding new areas to exploit. For example, the survey found that the use of finance process optimization (for cost reduction, accuracy and speed) is expected to grow from 21 percent to 73 percent. Survey respondents expect to apply analytics to the following finance activities:

  • Optimizing planning, budgeting, and forecasting processes
  • Integrating macro-economic data, industry trends and competitor data
  • Revenue forecasting

Now is the time to think about how you are currently using analytics in finance, and where you want to take your team’s use of analytics. The question really isn’t how can you use analytics in finance, but more how can’t you use analytics?

Home » Analytics » Page 22

Filed Under: News & Events Tagged With: Analytics, Budgeting, Financial Performance Management, Planning & Reporting

Pull a Rabbit Out of Your Hat – Or at Least Pull Insight from Your Data

August 1, 2017 by Justin Croft Leave a Comment

News and events

Nearly every company we work with has some amount of unstructured or text-based data that they collect from their customers and operations. Data from surveys, notes typed into CRM systems, emails, and more – all these unstructured text data sources can be a wealth of insight. And while everyone has this data, no one we’ve met is satisfied with the way they are leveraging text-based data.

IBM’s SPSS Modeler product includes a solution to this challenge – its Text Analytics workbench is designed to process, analyze, and understand written data. The TA component then gives you options for turning unstructured, free-form data into highly structured, usable insights.

Common uses for Text Analytics include:

  • Examining data at the customer level to identify sentiment (positive, neutral, negative)
  • Systematically identify keywords and topics that appear in the data
  • Categorize or code transactions (or responses) into groups based on their content and/or sentiment

But let’s look closer at an example…

Revelwood Car Rental has just started sending its customers a satisfaction survey. The customer responses are below – insightful if you read each one, but how do you scale this up?

Find insight from data with analytic

The Text Analytics workbench provides automatic concept extraction from the survey responses – that tells you what people are saying. You can then group topics into higher level categories to better manage and report on responses.

Text Analytics Workbench screeenshot

Finally, SPSS Modeler makes it easy to produce high-level stats on responses. Or better yet, you can feed this text insight into a customer retention or upsell model, where it will help directly drive incremental revenue.

IBM SPSS Modeler screenshot

Our clients who adopt this statistical approach to their data and business problems typically see dramatic returns on their effort. If you want to learn more about how get started with Text Analytics, or how to generate business results using text-based insights, contact us. We might just be able to help you pull a rabbit out of your hat – or at least out of your data.

Home » Analytics » Page 22

Filed Under: News & Events Tagged With: Analytics, Data Sceince, IBM SPSS Modeler, Predictive Analytics

Revelwood Named Ingram Micro IBM Analytics Growth Partner of the Year

August 1, 2017 by Lisa Minneci Leave a Comment

Awards & Recognition

Business travel can sometimes be more obligation than enjoyment. There’s always the chance of flight delays and other transportation snafus, long days, and often, the expectation of keeping up with your day job while being out of the office for work. But sometimes there’s that special business trip you look forward to!

That’s how we feel about the annual Ingram ICE event. “ICE” stands for Ingram Cognos Elite and it’s an exclusive program for IBM business partners who demonstrate expertise in selling IBM Cognos solutions. Every year, this event is held in a different location. This year, the ICE event took place in sunny Key Largo, Florida which is always a fun place to have a business trip. To make it even more exciting, this was the second year in a row that Revelwood was named the Ingram Micro IBM Analytics Growth Partner of the Year!

“Revelwood has done an incredible job growing their IBM analytics business through portfolio expansion and new client acquisition,” said David Hino, senior vendor business manager for IBM Software, Ingram Micro. “They are part of an elite group of Ingram Micro and IBM partners that many could learn from.”

Revelwood celebrates earning the Ingram Micro IBM Analytics Growth Partner of the Year award for 2016

From left to right: Vincent Zandvliet, global managing director for IBM/Ingram Partnership, IBM; Scott Zahl, vice president & general manager for Advanced Computing Division, Ingram Micro; Ken Wolf, CEO, Revelwood; Dave Hino, senior vendor business manager for IBM Software, Ingram Micro; Laurie Evans, worldwide channels leader for analytics, IBM.

Our CEO, Ken Wolf, was on-hand to accept the award, but it was earned by the entire Revelwood team. As Ken said in our press release, “Our team earned this award because we have continued to grow our established practice in financial and operational analytics, while also building a successful and award-winning practice in customer analytics and artificial intelligence.” As you can see from the photo, Ken had a great time at the event!

Home » Analytics » Page 22

Filed Under: Awards & Recognition Tagged With: Advanced Analytics, Analytics, Budgeting, Customer Analytics, Data Science, Financial Performance Management, Predictive Analytics

IBM Cognos TM1 Streamlines Finance Activities at Rayonier

July 30, 2017 by Lisa Minneci Leave a Comment

Success Stories

IBM Cognos TM1 streamlines finance activities for our client, Rayonier, when they transitioned from traditional, spreadsheet-based financial planning and reporting processes. But the company also realized some unexpected benefits of using TM1.

Rayonier is a real estate investment trust (REIT) and one of the largest private landowners in the U.S. The company owns, leases or manages approximately 2.7 million acres of timberlands in the U.S. South, U.S. Pacific Northwest and New Zealand, supplying timber to a wide variety of markets, including pulp, paper, lumber, renewable energy production and other wood products.

In 2014 the company spun off its manufacturing business, which marked a perfect opportunity for the finance group to consolidate the multiple budgeting, planning and reporting systems it had acquired over many decades in business. The company also decided to overhaul its entire chart of accounts. These changes set the stage for the organization to move off of various systems and consolidate its financials onto TM1.

Today, Rayonier relies on TM1 for many different aspects of its financial planning and reporting processes. The company sees many benefits from using TM1, including:

  • Streamlined processes with faster and more efficient close processes
  • Greater visibility, increased participation and more ownership of numbers
  • Significant hard and soft financial savings

“We now have a much more streamlined process than before,” said Bill Tan, senior accounting manager, Rayonier. “We’re no longer maintaining multiple systems. We estimate we’ve reduced our close process by 15%.”

It’s the soft financial savings that are the unexpected benefits of using IBM Cognos TM1. Moving off of multiple systems onto one universal solution has significantly reduced the amount of training new employees need to go through. “Activities that used to take several days can now be done in less than a day,” said Tan. “We have much more visibility, and we’ve pushed planning down to more individuals. People are now much closer to the process. And overall, people are much more productive.”

Another key benefit of moving to TM1 was that, according to Keith Tucker, senior accountant at Rayonier, “retiring legacy systems saved licensing costs and server costs.”

Read the full case study on how Rayonier is using TM1 for financial planning and reporting.

Read more about how IBM Cognos TM1 is used by REITs:

IBM Cognos TM1 for Capacity Planning in the REIT Industry

Home » Analytics » Page 22

Filed Under: Success Stories Tagged With: Analytics, Budgeting, Financial Performance Management, Planning & Reporting, Real Estate

  • « Go to Previous Page
  • Page 1
  • Interim pages omitted …
  • Page 20
  • Page 21
  • Page 22
  • Page 23
  • Page 24
  • Interim pages omitted …
  • Page 26
  • Go to Next Page »

Footer

Revelwood Overview

Revelwood helps finance organizations close, consolidate, plan, monitor and analyze business performance. As experts in solutions for the Office of Finance, we partner with best-in-breed software companies by applying best practices guidance and our pre-configured applications to help businesses achieve their full potential.

EXPERTISE

  • Workday Adaptive Planning
  • IBM Planning Analytics
  • BlackLine

ABOUT

  • Who We Are
  • What We Do
  • How We Help
  • How We Think
  • Privacy

CONNECT

World Headquarters

Florham Park, NJ | 201 984 3030

European Headquarters

London & Edinburgh | +44 (0)131 240 3866

Latin America Office

Miami, FL | 201 987 4198

Email
info@revelwood.com

Copyright © 2025 · Revelwood Inc. All rights reserved. Revelwood® and the Revelwood logo are registered marks of Revelwood Inc.