Fly…Fly;
Ring…Ring;
Wave…Wave;
Bat…Bat
In the above examples:
Am I talking about a fly that’s buzzing around my head or are we getting on a plane to fly somewhere? Is that the ring from a telephone or a fancy diamond ring? Did someone just wave at you from across the room or are we going surfing on a big wave? Did we just see a bat fly out of a cave or did I pick up my bat and step to the plate?
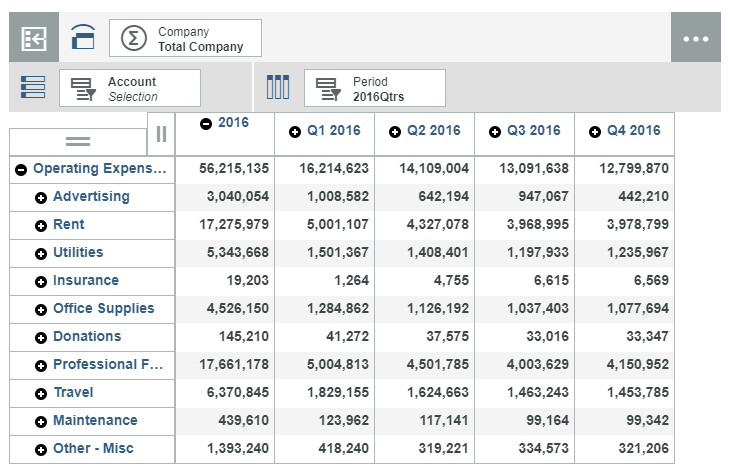
Metadata management is extremely important because names matter. Context matters. Metadata management covers a whole host of data governance issues, but I want to simply focus on the naming conventions you choose for your accounts, departments, locations and other elements in your dimensions. You must enforce standard nomenclature throughout your systems. This is not an easy exercise, but it is absolutely necessary.
We often play games with nomenclature so we can circumvent our system’s rules or logic. Perhaps you “need” to tweak a formula or consolidated roll-up to meet one internal customer’s exact specifications so you alter the name slightly.
- “U.S. Operations” vs “U.S. Ops” where you include Canada and Mexico in one since the manager is responsible for North America as a whole
- “Total International” vs “Total Intl” where you exclude EMEA from one because that tells a better story
- “Total Salary” vs “Total_Salary” where certain bonuses are included in one of them due to different comp plans
Who’s that going to hurt? Right? It will come back to haunt you and it makes it difficult for your typical end user to understand what they are looking at.
My general rule of thumb is to print a copy of any analysis or report and then look at it to see if everything is clear. A hard copy takes it out of its context and it needs to stand alone. At some point, a print out of your report will end up on someone’s desk and you will be called out for a number that is “wrong” simply because similar names have different meanings. I have received more than one panicked phone call from the C suite telling me that my numbers were wrong. They had the proof! A hard copy report that someone gave them was in their hands and it contradicted the numbers I just gave them. I hope my point is clear – there will always be a hard copy. Make sure that copy is crystal clear.
There are any number of software solutions you can purchase to help you manage this, but you can create a homegrown process easily as well. This doesn’t have to be anything fancy, just bring everyone to the table. While at Hertz, I created a Data Governance team and process that included a member from our Domestic and International FP&A teams, Accounting, Operations and Corporate. Before I agreed to add anything to our planning and reporting system, this team needed to meet to discuss and agree on a naming convention. It may sound silly, but I can ensure you that these meetings saved countless hours of reconciling differences between reports.
We have all heard the adage about “sticks and stones.” Perhaps I just shed a different light on that old tale. At least in this context, names really can hurt.
Read more blog posts in our FP&A Done Right series:
FP&A Done Right: The Flexibility of Today’s FP&A Systems is Both a Blessing and a Curse
FP&A Done Right: Finance as the Conductor