Have you ever created an IBM Planning Analytics Workspace (PAW) book and wanted to have more control over the look of the tabs? PAW version 57 introduced many settings that allow you to control formatting details about the tabs. These details include settings that define where the tabs appear on the screen and settings that define the colors associated with the tabs. These settings are found within the general area of the dashboard properties settings.
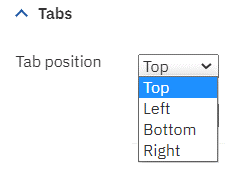
One setting defines where the tabs will be located on the page. Moving the tabs to the bottom will make your PAW book appear like a default excel workbook.
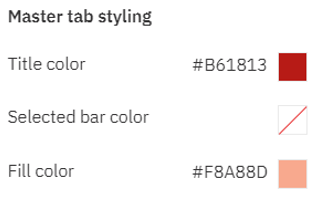
Another group of settings define the colors associated with the tabs. There are three different settings to define the colors. Title color will define the color of the text within each tab, selected bar color will define the color of the line under the active tab, and fill color will define the background color of the tabs.
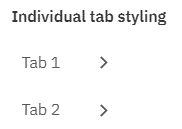
In addition, there are settings which allow you to override the “all tab” settings. These settings allow you to make a single tab use different coloring.
These new settings give you more control of the appearance of your PAW books and can be used to further customize your user experience.
IBM Planning Analytics, powered by TM1, is full of new features and functionality. Need advice? Our team here at Revelwood can help. Contact us for more information at info@revelwood.com. We post new Planning Analytics Tips & Tricks weekly in our Knowledge Center and in newsletters.
Read more IBM Planning Analytics Tips & Tricks posts:
IBM Planning Analytics Tips & Tricks: Change Element Types in PAW