• Skip to main content
  • Skip to footer
Revelwood Logo

Revelwood

Your SUPER-powered WP Engine Site

  • Who We Are
    • About Us
      • Our Company
      • Our Team
      • Partners
    • Careers
      • Join Our Team
  • What We Do
    • Solutions
      • Workday Adaptive Planning
      • IBM Planning Analytics
      • BlackLine
    • Services
      • Implementation Services
      • Customer Care
        • Help Desk
        • System Administration as a Service
      • Training
        • Workday Adaptive Planning Training
        • IBM Planning Analytics / TM1 Training
    • Products
      • DataMaestro
      • LightSpeed
      • IBM Planning Analytics Utilities
  • How We Help
    • Use Cases
    • Client Success Stories
  • How We Think
    • Knowledge Center
    • Events
    • News
  • Contact Us

Financial Performance Management

IBM Planning Analytics Tips & Tricks: Excel Tips, Part 3

April 11, 2023 by Revelwood

Revelwood’s IBM Planning Analytics team has created numerous tips & tricks focused on helping people use Excel. Over the next few weeks, we’ll be highlighting some of the most popular and interesting posts on Excel. If you’ve missed our earlier posts, read part 1 and part 2.

IBM Planning Analytics Tips & Tricks: Map Charts

Map charts is a nifty feature in Excel that will help visualize your data. It enables you to compare values and show categories across geographical regions.

Our blog post explains how you can use the Map Charts feature.

IBM Planning Analytics Tips & Tricks: Excel’s CONCAT and TEXTJOIN Functions

In recent years Microsoft introduced a new version of the CONCATENATE functional called CONCAT. Their purpose is similar in that the new function still combines text from multiple ranges and/or strings. CONCAT will eventually replace CONCATENATE.

The TEXTJOIN function joins text from multiple ranges and/or strings but includes two additional parameters. These parameters allow you to specific the delimiter and determine if empty cells are ignored. 

Learn more about Excel’s CONCAT and TEXTJOIN functions. 

IBM Planning Analytics Tips & Tricks: Excel’s IFS Function

Excel’s IF function has been around for quite a while. Back in 2020, Excel introduced the IFS function. This function checks whether one or more conditions are met and then returns the value associated with the first TRUE condition. The main objective of IFS is to simplify an expression that would have previously required multiple nested IF functions.Read our blog post to learn the format of the IFS function.

IBM Planning Analytics, which TM1 is the engine for, is full of new features and functionality. Not sure where to start? Our team here at Revelwood can help. Contact us for more information at info@revelwood.com. And stay tuned for more Planning Analytics Tips & Tricks weekly in our Knowledge Center and in upcoming newsletters!

Read more IBM Planning Analytics Tips & Tricks:

IBM Planning Analytics Tips & Tricks: Excel Tips, Part 1

IBM Planning Analytics Tips & Tricks: Excel Tips, Part 2

IBM Planning Analytics Tips & Tricks: Excel EOMONTH

Home » Financial Performance Management » Page 6

Filed Under: IBM Planning Analytics Tips & Tricks Tagged With: Financial Performance Management, IBM Planning Analytics, IBM Planning Analytics Tips & Tricks, TM1

Workday Adaptive Planning Framework: Purchase Order Management for Organization-Wide Planning

March 29, 2023 by Revelwood

Purchase orders are typically viewed from a procurement perspective – usually to make key decisions about sales and inventory, or to audit vendors. But they can also provide the finance and project management teams with important information for planning processes. You can give key members of your planning team more direct access to these purchase orders by incorporating them into Workday Adaptive Planning.

In this video, Haley Elliot, presales solutions consultant here at Revelwood, demonstrates how Workday Adaptive Planning’s purchase order functionality can be used as a unified data point for teams across the organization. These include procurement, finance and project management. 

By incorporating purchase orders with Workday Adaptive Planning you can transform your purchase order details from siloed and static information into dynamic forecasts that can be leveraged in a planning process across multiple business units in your organization. 

This video is a Workday-approved planning template and is a conceptual framework for clients deploying Workday Adaptive Planning. This framework for purchase order management adheres to best-practice guidelines and has been validated by Workday with Revelwood clients who have successfully used it. 

Visit Revelwood’s Knowledge Center for our Workday Adaptive Planning Tips & Tricks or sign up here to get our Workday Adaptive Planning Tips & Tricks delivered directly to your inbox. Not sure where to start with Workday Adaptive Planning? Our team here at Revelwood can help! Contact us info@revelwood.com for more information.

Learn More about Workday Adaptive Planning:

Fueling Business Agility with Continuous Planning

FP&A Done Right: ESG – An Imperative for Growth

FP&A Done Right: Forecasting Revenue for Services-Based Businesses: A Growth Factor

Home » Financial Performance Management » Page 6

Filed Under: Workday Adaptive Planning Tips & Tricks Tagged With: Financial Performance Management, Workday Adaptive Planning, Workday Adaptive Planning Tips & Tricks, Workday Adaptive Planning tutorial

Ventana: Continuous Accounting Helps Companies Close Faster

March 23, 2023 by Revelwood

Ventana Research, an authoritative and respected market research and advisory services firm, recently looked at Revelwood’s partner Fluence Technologies and how the company helps organizations automate tasks for faster monthly, quarterly and annual closing. 

According to Ventana, by 2025 two-thirds of midsized organizations will have applied continuous accounting principles to close their monthly books within one business week. A key objective of continuous accounting is achieving a fast, clean close. 

This is part of a larger digital transformation of accounting departments, which aims to eliminate manual tasks such as consolidations and reconciliations by using software automation. 

The firm’s Smart Close Dynamic Insights report shows:

Chart, sunburst chart

Description automatically generated

  • 56% of organizations close their month within six business days 
  • 40% of organizations complete their quarterly close in six business days
  • 69% of those that automate all most of the close process complete the quarterly close within six days
  • Only 29% of companies that only use some or no software automation close within that six-day window

Ventana states, “Financial executives who are committed to enabling their finance organization to play a more strategic role in their company should focus on ways to streamline their close process.”

Read the full piece on continuous accounting and Fluence Technologies.

Read more about Fluence Technologies:

FP&A Done Right: The Role of Narrative Reporting in ESG

Fluence Technologies Earns “Outstanding” Overall BPM Pulse Rating from BPM Partners

Home » Financial Performance Management » Page 6

Filed Under: Financial Close & Consolidation Tagged With: financial close, Financial Close and Consolidation, Financial Performance Management, fluence, Fluence Technologies

IBM Planning Analytics Tips and Tricks: Upgrading to Planning Analytics for Excel 2.0.65 or later

March 21, 2023 by Marc Assenza

As of version IBM Planning Analytics version 2.0.65, you can choose to either launch IBM Planning Analytics for Excel (PAx) as a single session (by double-clicking the .XLL file) or load it as an add-in (and have it available for all Excel sessions).

To install the latest version of PAx, first uninstall any version prior to 2.0.65. Once completed, download the.xll file associated with the version you want to install. Be sure to use a file that correlates with either your 32-bit version of Microsoft Excel or your 64-bit version of Microsoft Excel. You can check which version of Excel you have by clicking on File, Account:

A picture containing table

Description automatically generated

Within that menu, click on the link that reads “About Excel.”

Text

Description automatically generated

Details about your version will then appear, including the bit version. Here is an example of what you may see:

A picture containing rectangle

Description automatically generated

Once downloaded, you can configure the .xll file as an Excel add-in or you can simply double-click the file to run PAx. I prefer to launch the .xll file individually for a single session of Excel and not allow it to persist across all my Excel sessions. Therefore, I created a folder named “PAfe” and placed the .xll file in the folder. I then created a shortcut from my desktop pointing to the file. This approach allows me to perform future upgrades by simply replacing a single file!

Revelwood has worked with IBM Planning Analytics / TM1 for more than 27 years. We’ve partnered with hundreds of companies on the design, development, maintenance and updates of IBM Planning Analytics applications, across every industry. Have a challenge with Planning Analytics / TM1? We can help you!

Read more IBM Planning Analytics Tips & Tricks:

IBM Planning Analytics Tips & Tricks: Excel Tips, Part 2

IBM Planning Analytics Tips & Tricks: Excel EOMONTH

IBM Planning Analytics Tips & Tricks: Excel Tips, Part 1

Home » Financial Performance Management » Page 6

Filed Under: IBM Planning Analytics Tips & Tricks Tagged With: Financial Performance Management, IBM Planning Analytics, IBM Planning Analytics Tips & Tricks, TM1

Embracing Forward-Looking and Customer-Centric KPIs

March 17, 2023 by Revelwood

This is a blog post from our partner Workday Adaptive Planning, highlighting a virtual panel discussion on “The Emerging CFO: Rethinking KPIs in the Digital Era.”

Revenue. Profit. Sales. Cash. The metrics that have traditionally defined business success remain relevant but are quickly evolving. Today, more executives are shifting their focus to bring forward-looking key performance indicators (KPIs) into the mix.

From customer lifetime value (CLV) to net retention rate (NRR) to customer satisfaction (CSAT), CFOs are looking to nonfinancial metrics to help them predict the future financial health and profitability of their organizations. Of particular note is the move toward more customer-focused metrics, a reaction to an increasingly data-driven consumer.

“The fact that every single customer you have has a supercomputer in their purse or their pocket changes the way that we can analyze data and engage with people,” said Michael Schrage, research fellow at the MIT Sloan School Initiative on the Digital Economy, in a virtual panel hosted by Fortune and Workday. 

A broader, more holistic set of KPIs lets finance leaders make proactive, strategic decisions rather than simply reacting to change. The idea, Schrage said, is to move toward more future-predictive, future-orientated KPIs versus ones that simply confirm that an organization made a wrong move. “That doesn’t help you very much,” he said. 

The panel, which discussed the evolving role of the CFO, also included Harmit Singh, executive vice president and CFO at Levi Strauss & Co.; Alka Tandan, CFO at Gainsight; and Kae Arima, vice president of finance at Workday. The conversation revolved around how KPIs are changing in the digital era and how CFOs must shift their perspective. 

Where Is the Juice Worth the Squeeze?

As data becomes easier to collect and analyze, business leaders are turning to measurement, instrumentation, and analytics to gain insights around performance. They’re also assessing the portfolio of KPIs across the enterprise to see how specific metrics correlate. For instance, does a positive employee experience correspond to higher customer lifetime value? How do both of those KPIs affect the bottom line? 

Looking at a broader portfolio of KPIs lets leaders understand where work is producing the most valuable results. For example, going beyond gross customer retention rates to NRR helps leaders understand which customer segments are stable, which ones are growing—and how much effort it takes to cultivate that growth.

“Especially in an environment where money is now a lot more expensive and it takes a lot more money to acquire a new customer, looking at your current customer base and growing it that way becomes a lot more efficient,” Tandan said.

Taking a more holistic view of data can also help leaders see which teams are doing the most to achieve business goals. Determining what portion of customer lifetime value growth can be attributed to sales, customer success, and operations, for example, offers insights that could inform future strategies and investments.

How Do You Get Hard Numbers?

Going forward, CFOs will need to more actively identify what attributes are associated with success, so the organization can update and monitor KPIs accordingly. But getting there requires access to reliable, real-time business intelligence—and data doesn’t flow freely across many organizations. 

“For something like customer lifetime value, finance is really dependent on the sales organization or the marketing organization to share that data with them. And that’s not always easy,” Arima said. 

Singh recounted his experience during his early days at Levi’s, which was a highly customized systems, applications, and products shop when he came on board. Each region had its own enterprise resource planning (ERP) tool and the company had more than 10 data warehouses. 

“And so the data didn’t necessarily talk to each other, and people were using different ERPs that didn’t talk to each other,” Singh said. At the time, he suggested moving the company onto a single ERP system, but he was told it would be a career-limiting move and that he should focus on turning around the company first. So, he moved the data into one warehouse that is now being converted into a single ERP system on the cloud. 

“I told my technology folks—including the board because it’s a major investment—that the success of the ERP is not going to be driven by the technology,” Singh said. “It’s going to be driven by the data unlock and the data governance that is going to happen.”

Who Owns All That Data?

Real-time data platforms can also boost performance on the front lines. “We connect with our consumers either through retailers or directly in our stores,” Singh said. “So, arming our retail associates with data and empowering them to make decisions based on data is critical.” 

Giving employees information about customer buying trends could help them focus their attention on the right upselling decisions. It also helps store managers see where their location may be underperforming and find ways to improve. Store managers can also input their own observations on what’s working and what isn’t into company apps that associates can access.

However, giving teams access to customer and operational data requires strong data governance—and agreement across the enterprise. But leaders often disagree about who owns particular KPIs, how they should be shared, and who is accountable, which means CFOs will need to play a larger role in closing the gap and arbitrating conflict. That’s been the case at Gainsight, where Tandan says she has taken on the responsibility for data validation. This helps ensure there is a single source of truth the executive team can work from.

The organization also identifies which executives are responsible for key metrics and creates a one-page strategic plan for each employee based on the KPIs and the executives responsible for them.

“So every single employee—if they’re attached to that executive—has a piece of [that metric],” Tandan said.

Regularly reviewing KPIs to ensure they’re in alignment with current business conditions is critical, Tandan said. That way, CFOs can ensure that their organizations remain relevant in a rapidly changing economic environment.

Watch the Fortune webcast: “The Emerging CFO: Rethinking KPIs in the Digital Era.” This blog post was originally published on the Workday blog.

More from Workday Adaptive Planning:

FP&A Done Right: ESG – An Imperative for Growth

FP&A Done Right: Forecasting Revenue for Services-Based Businesses: A Growth Factor

FP&A Done Right: The Changing Role of the CFO

Home » Financial Performance Management » Page 6

Filed Under: FP&A Done Right Tagged With: Budgeting Planning & Forecasting, Financial Performance Management, Workday, Workday Adaptive Planning

IBM Planning Analytics Tips & Tricks: Excel YEARFRAC
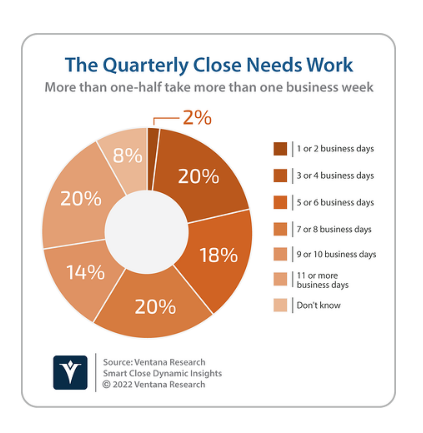
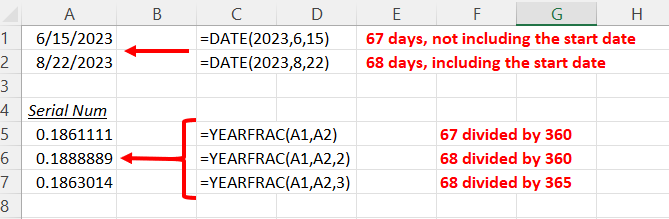
March 14, 2023 by Lee Lazarow

I often build models that define the fraction of a year for a given month. For example, January is approx. 8.5% of a calendar year (31/365) and September is approx. 11.5% of a working day’s calendar (30/260). But what happens in situations when you want to calculate the percentage of a year where the days are not the first or last day of the month? This is where Excel’s YEARFRAC formula can help.

The YEARFRAC function calculates the fraction of a year based on the number of whole days between two dates. Maybe you have summer employees and want to determine how much of the calendar year they will be employed or maybe you need to rent some equipment and pay based on an annual rate.

The function has two required parameters and one optional parameter:

=YEARFRAC(start_date, end_date, [basis])

  • Start_date (required)
    • Microsoft recommends using the DATE function for this value
  • End_date (required)
    • Microsoft recommends using the DATE function for this value
  • Basis (optional)
    • This determines the denominator using a series of approaches such as 360 vs 365 and whether you want to include the start date

Application, table, Excel

Description automatically generated

This function will allow you to quickly calculate decimals which can then be used for various forms of allocations, seasonality, and other types of spreads.

Revelwood has worked with IBM Planning Analytics / TM1 for more than 27 years. We’ve partnered with hundreds of companies on the design, development, maintenance and updates of IBM Planning Analytics applications, across every industry. Have a challenge with Planning Analytics / TM1? We can help you!

Read more IBM Planning Analytics Tips & Tricks:

IBM Planning Analytics Tips & Tricks: 21/21/21

IBM Planning Analytics Tips & Tricks: Beginning to Explore the Set Editor in Planning Analytics for Excel

IBM Planning Analytics Tips & Tricks: Creating Control Objects from the Modeling Workbench

Home » Financial Performance Management » Page 6

Filed Under: IBM Planning Analytics Tips & Tricks Tagged With: Budgeting Planning & Forecasting, Financial Performance Management, IBM Planning Analytics, TM1

Fueling Business Agility with Continuous Planning

March 3, 2023 by Revelwood

FP&A Done Right: Finance’s Role in ESG Reporting

This is a guest blog post from our partner Workday Adaptive Planning. The author, Bob Hansen, explaining how continuous planning enables business agility. 

Each finance leader knows the routine. Every year, as budgeting season approaches, the rest of the business turns to finance in order to make sense of the last 12 months and prepare for the next 12.

First, you look backward, to assess the progress toward last year’s stated objectives. You work with manually aggregated data and consolidated spreadsheets (both often error-prone) to discover results and generate reports. You analyze targets, performance, and spending to provide the business with an accurate reflection of its financial position.

And then you look forward, using that information to plan next year’s objectives. You think about future goals and enshrine them in a firm financial strategy. You make choices, assess trade-offs, and accept sacrifices. You settle on a new top-line target and divide it into contributions between different functional teams.

Then—after spending weeks or months laboring over the annual plan—by the time it’s finished, the market has changed dramatically and its assumptions are out of date.

Case in point: The disruption caused by COVID-19. Or even more recently, an economy with surprising, seemingly contradictory indicators. But there’s a better way: continuous planning.

Looking Ahead

Continuous planning gives financial planning and analysis (FP&A) organizations a real-time view of the business. When decision-makers have the ability to understand what’s happening with the business now, they can accurately model what is likely to happen in the future. Unlike outdated, static planning, continuous planning enables agility with plans that are always current, insight with easily created and iterated what-if scenarios.

Instead of being once-a-year exercises, rolling forecasts happen on a regular cadence. Unlike budgets that may have hundreds of line items, rolling forecasts address key business drivers. And rather than focusing on the past, rolling forecasts act as early warning systems when you’ve drifted off course; they help to raise visibility beyond the traditional budgeting “wall.” By continually updating your forecast with actuals, you’ll be able to quickly adjust the levers that drive performance.

Here’s a three-step plan to help you design more useful rolling forecasts:

1. Choose the right forecasting horizon.

A rolling forecast is aligned to business cycles, rather than the fiscal year. To really help senior management look at the future and proactively handle it, a best practice is to forecast at least four to eight quarters past the current quarter’s actuals. However, there’s no hard-and-fast guideline for the time interval included in a rolling forecast. It all depends on your industry, your business needs, and how long it takes to make decisions about operations, capacity, and spending. 

2. Model your course on drivers not details.

Yes, your annual budget lists thousands of line items, but you need to perform rolling forecasts at a much higher level, or you’ll get bogged down in minutiae and your forecast will become a recompilation of budgets. Rolling forecasts based on key business drivers, rather than masses of detail, also become a “light-touch” process and therefore less onerous for everyone involved. Managers may mutiny if they think that rolling forecasts will require the work of a full budget, but they’ll be much more engaged if they know they can zero in on the few key variables that matter.

3. Sound out multiple what-if scenarios.

The beauty of rolling forecasts is they allow you to model what-if scenarios to ensure your business keeps pace with change and is aligned to your corporate plan. By modifying a few key assumptions and drivers, you can see their effect on the overall plan, such as the impact a price change has on headcounts and cash. For example, with what-if analyses, managers can perform studies that translate contemplated changes in product mix, processes, order parameters, and customer service into the implications for changes in resource supply and spending.

Executing Against Your Scenarios

Executing against your what-if analyses and scenario plans shouldn’t only happen once a year as part of a static annual budget and planning process. A changing marketplace calls for active, continuous planning and monitoring that gives decision-makers the real-time information they need to course-correct as needed. The ability to create scenario plans to assess potential outcomes (best case, worst case, most likely case) is extremely valuable when variables are constantly changing around and within your business.

At a minimum, this means continuously monitoring actuals so you can keep an eye on organizational financial health. It also means keeping track of your leading analytics indicators (e.g., pipeline, customer lifetime value, attrition), so you can identify trends and patterns and recommend course corrections when needed.

To execute against your scenario plans, you need to have access to easy-to-use, flexible, and robust reporting that captures all of the above, and does so on a continuous basis. And when the gathering, reconciliation, and distribution of your reports is automated, you’ll be able to transform reporting processes from a monthly rote exercise to a dynamic, ongoing driver of organizational change.

With a continuous view of the business, everyone in the company will be empowered to plan and see the results of the implementation and the execution of those plans.This blog post was originally published on the Workday Adaptive Planning blog.

More from Workday Adaptive Planning:

FP&A Done Right: ESG – An Imperative for Growth

FP&A Done Right: Forecasting Revenue for Services-Based Businesses: A Growth Factor

FP&A Done Right: The Changing Role of the CFO

Home » Financial Performance Management » Page 6

Filed Under: FP&A Done Right Tagged With: Budgeting Planning & Forecasting, Financial Performance Management, Workday, Workday Adaptive Planning

IBM Planning Analytics Tips & Tricks: Charts in Planning Analytics Workspace, Part 2

January 31, 2023 by Revelwood

Did you know IBM Planning Analytics Workspace (PAW) gives you many options for showing data in charts? We recently shared a few tips and tricks for visualizing your data in charts. Here are some more.

Pie Chart Sizing

Did you know that PAW allows you to “split” your pie chart widget to define how much of the space is allocated to the legend and how much of the space is allocated to the chart? 

In this blog post, we explain how to view and modify the split. 

PAW Chart Multicolors

One of the visualizations in Planning Analytics is a column chart. This type of chart is a good way to compare items since all the lines are in proportion to each other.

Read this blog post to learn an easy way to create a column chart via an exploration. We then explain how to change that visualization into a column chart. 

Mekko Charts

PAW offers many visualization options to allow you to show and analyze your data in creative ways. This includes standard chart types such as bar, line and pie. But it also includes some reports that are not always understood. One of these report types is a Mekko chart.

A Mekko chart (also sometimes called a Marimekko chart) is used to extend a stacked column chart by using the width of each column to show the overall importance of that section. Read our blog post on using Mekko charts. 

IBM Planning Analytics, which TM1 is the engine for, is full of new features and functionality. Not sure where to start? Our team here at Revelwood can help. Contact us for more information at info@revelwood.com. And stay tuned for more Planning Analytics Tips & Tricks weekly in our Knowledge Center and in upcoming newsletters!

Read more IBM Planning Analytics Tips & Tricks:

IBM Planning Analytics Tips & Tricks: Charts in Planning Analytics Workspace, Part 1

IBM Planning Analytics Tips & Tricks: DefineCalc

IBM Planning Analytics Tips & Tricks: Top 3 Blog Posts of 2022

Home » Financial Performance Management » Page 6

Filed Under: IBM Planning Analytics Tips & Tricks Tagged With: Financial Performance Management, IBM Cognos TM1, IBM Planning Analytics, IBM Planning Analytics Tips & Tricks, Planning & Reporting, TM1

IBM Planning Analytics Tips & Tricks: How to Make an MDX Statement Dynamic

January 24, 2023 by Revelwood

Did you know we have a number of resources available to learn more about MDX? We hosted a two-part series on How to Use MDX in Your IBM Planning Analytics Series. We also published a blog post, IBM Planning Analytics Tips & Tricks: MDX Syntax Explained, to accompany part 1 of the webinar series. 

In part 2 of our MDX webinar series, we demonstrate how to make an MDX dynamic by using the power of Excel.

You’ll see we start with a basic Excel report, generated out of IBM Planning Analytics for Excel (PAx). We then take the static, base MDX and turn it into a concatenation of parts of the index statement and the cell reference. In turn, that enables us to change the root account, thereby changing the data that shows in the report.

Watch the full webinar to learn more about working with MDX.

Revelwood has worked with IBM Planning Analytics / TM1 for more than 27 years. We’ve partnered with hundreds of companies on the design, development, maintenance and updates of IBM Planning Analytics applications, across every industry. Have a challenge with Planning Analytics / TM1? We can help you!

Read more IBM Planning Analytics Tips & Tricks on MDX:

IBM Planning Analytics Tips & Tricks: An Approach to Strengthening your MDX Skills

IBM Planning Analytics Tips & Tricks: Using MDX to Compare Dimension Hierarchies

IBM Planning Analytics Tips & Tricks: Making Default Cube Views Dynamic with MDX

Home » Financial Performance Management » Page 6

Filed Under: IBM Planning Analytics Tips & Tricks Tagged With: Financial Performance Management, IBM Planning Analytics, IBM Planning Analytics Tips & Tricks, Planning & Forecasting, TM1

  • « Go to Previous Page
  • Page 1
  • Interim pages omitted …
  • Page 4
  • Page 5
  • Page 6
  • Page 7
  • Page 8
  • Interim pages omitted …
  • Page 47
  • Go to Next Page »

Footer

Revelwood Overview

Revelwood helps finance organizations close, consolidate, plan, monitor and analyze business performance. As experts in solutions for the Office of Finance, we partner with best-in-breed software companies by applying best practices guidance and our pre-configured applications to help businesses achieve their full potential.

EXPERTISE

  • Workday Adaptive Planning
  • IBM Planning Analytics
  • BlackLine

ABOUT

  • Who We Are
  • What We Do
  • How We Help
  • How We Think
  • Privacy

CONNECT

World Headquarters

Florham Park, NJ | 201 984 3030

European Headquarters

London & Edinburgh | +44 (0)131 240 3866

Latin America Office

Miami, FL | 201 987 4198

Email
info@revelwood.com

Copyright © 2025 · Revelwood Inc. All rights reserved. Revelwood® and the Revelwood logo are registered marks of Revelwood Inc.