Charts can be an incredibly powerful tool for communicating complex data in an accessible and visually appealing way. In the world of enterprise planning, IBM Planning Analytics provides users with the ability to create detailed and informative charts through its workspace interface, Planning Analytics Workspace (PAW).
This blog post is based on a recent webinar on creating PAW charts in the New Experience. We explore some of the key features and techniques for creating charts in PAW and how they can help your organization make more informed decisions.
Getting Started: The Basics of PAW
Before getting into creating charts, it’s worth taking a quick look at the basics of PAW and how it works. PAW is a web-based interface that allows users to easily access and analyze data stored within IBM Planning Analytics. It includes a range of features and tools for exploration, analysis, and reporting, with the ability to create custom dashboards, reports, and visualizations.
PAW offers two different versions, Classic and the New Experience. While the Classic version is still available, the New Experience offers a more modern and intuitive user interface, with added applications and plans, Watson-related components, and changes to administration and charting functions.
Types of Visualizations
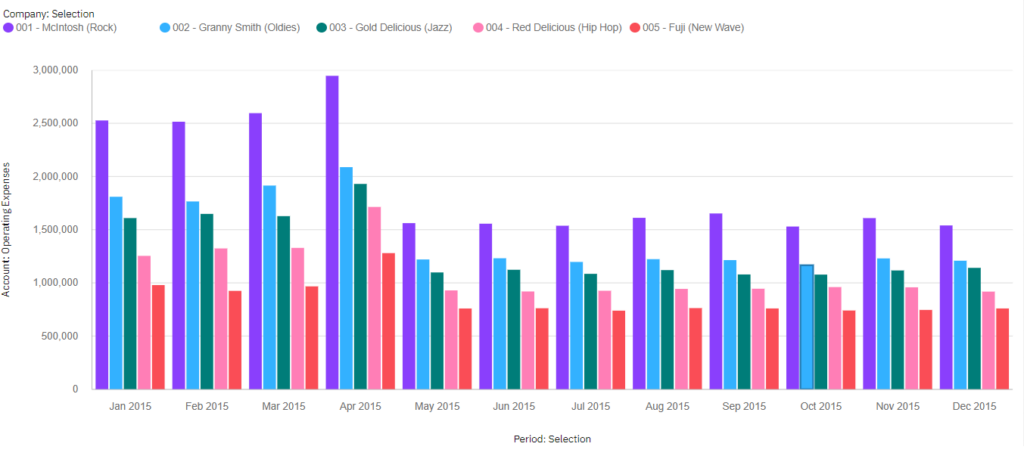
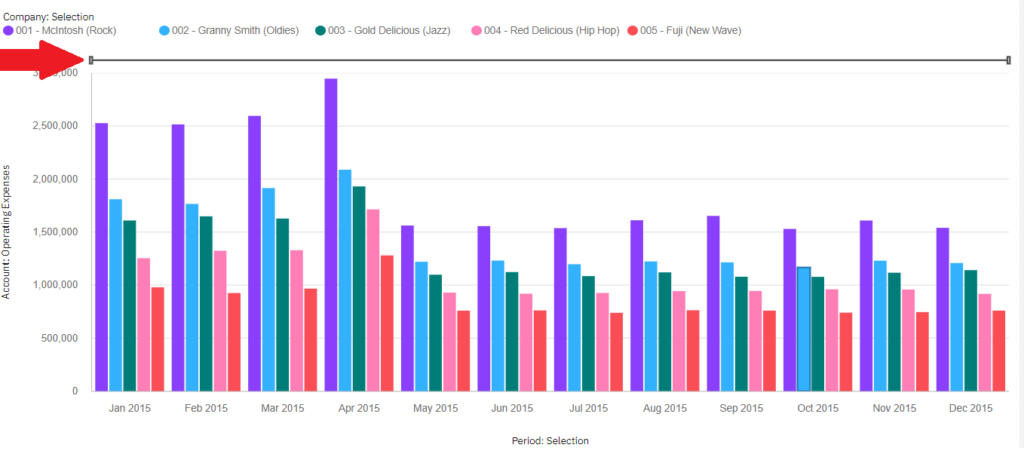
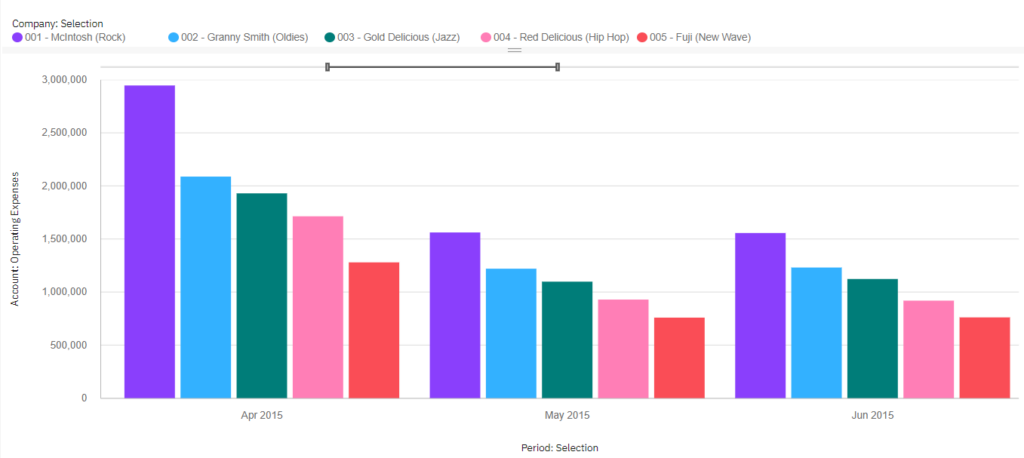
Once you have a basic understanding of PAW, it’s time to start exploring the different types of visualizations that can be created. PAW offers a variety of chart types that can help you visualize your data, including comparison, composition, and trend charts.
Comparison charts are useful when you want to compare two or more data series side-by-side, such as comparing actual versus forecasted revenue. Composition charts, on the other hand, are used to show the composition of a single data series, such as the breakdown of sales by product category. Trend charts are ideal for highlighting trends and patterns over time, such as changes in website traffic or sales revenue.
Creating a Chart: The Three Approaches
When it comes to creating a chart in PAW, there are three main approaches you can take. The first is to convert an existing Exploration to a chart, which can be done using drag-and-drop functionality and a subset editor. This approach is great when you already have an Exploration with the data you want to visualize.
The second approach is to duplicate an existing chart and make tweaks to it as needed. This is useful when you want to create multiple similar charts quickly without having to start from scratch each time.
Finally, the third approach is to manually create a visualization from scratch in a book. This approach allows for the most customization, as you can define the axes, filters, and formatting of the chart yourself.
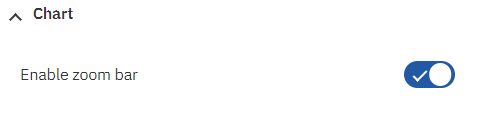
Once you’ve chosen your approach, it’s time to start customizing your chart. PAW provides a range of options for bars, length, start, target, repeat, and filters, allowing you to fine-tune your visualization to best suit your needs. You can also add value labels to the chart to provide additional context and make it easier for viewers to understand the data being presented.
Tips for Effective Chart Design
While creating a chart in PAW is relatively straightforward, there are some best practices to keep in mind to ensure your chart is as effective as possible. Here are a few tips to consider:
- Consider your audience: Who will be viewing your chart? Make sure the design and content are appropriate for your intended audience.
- Keep it simple: Don’t try to cram too much information onto one chart. Focus on the key data points and keep the design clean and uncluttered.
- Use the right chart type: Make sure you choose the chart type that best suits the data you are presenting and the story you want to tell.
- Label everything: Be sure to label all axes, data points, and categories to ensure your chart is clear and easy to understand.
- Use color wisely: Colors can be a great way to highlight important data points, but be sure to use them sparingly and consistently across all your charts.
Conclusion
Creating charts in PAW can be a powerful way to communicate complex data in a clear and accessible way. With a range of chart types and customization options, PAW provides users with the tools they need to create informative and visually appealing visualizations. Keep these tips in mind as you start experimenting with creating charts in PAW, and you’ll be on your way to creating clear, compelling reports that drive informed decision-making.
IBM Planning Analytics, which TM1 is the engine for, is full of new features and functionality. Not sure where to start? Our team here at Revelwood can help. Contact us for more information at info@revelwood.com. And stay tuned for more Planning Analytics Tips & Tricks weekly in our Knowledge Center and in upcoming newsletters!
Read more IBM Planning Analytics Tips & Tricks:
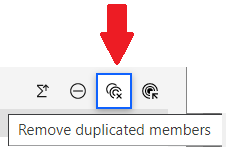
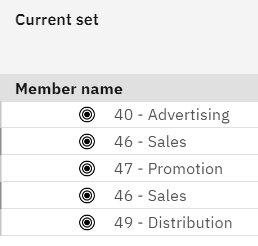
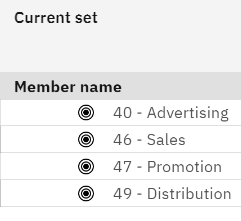
IBM Planning Analytics Tips & Tricks: PAW Set Editor Remove Duplicates
IBM Planning Analytics Tips & Tricks: Popular Posts, Part 1
IBM Planning Analytics Tips & Tricks: Run TI Processes from PAx Task Pane