• Skip to main content
  • Skip to footer
Revelwood Logo

Revelwood

Your SUPER-powered WP Engine Site

  • Who We Are
    • About Us
      • Our Company
      • Our Team
      • Partners
    • Careers
      • Join Our Team
  • What We Do
    • Solutions
      • Workday Adaptive Planning
      • IBM Planning Analytics
      • BlackLine
    • Services
      • Implementation Services
      • Customer Care
        • Help Desk
        • System Administration as a Service
      • Training
        • Workday Adaptive Planning Training
        • IBM Planning Analytics / TM1 Training
    • Products
      • DataMaestro
      • LightSpeed
      • IBM Planning Analytics Utilities
  • How We Help
    • Use Cases
    • Client Success Stories
  • How We Think
    • Knowledge Center
    • Events
    • News
  • Contact Us

IBM Planning Analytics

Revelwood Launches Report Conversion Service for Migrating Excel & TM1 Web Reports to PAx

October 17, 2019 by John Pra Sisto Leave a Comment

News & Events

Revelwood has launched a new Report Conversion service to help TM1 users to migrate their Excel and TM1 Web (Websheets) reports to Planning Analytics for Excel (PAx). Our service also helps TM1 users recreate their existing Excel or TM1 Web reports in PAx.

As with all the aspects of migrating from TM1 to Planning Analytics, there is a significant benefit to migrating existing reports to the new platform. The biggest of these benefits is improving performance. When you migrate to, or recreate these reports in PAx, you’ll also be able to take advantage of both Active Forms and MDX to make the new versions of your reports truly dynamic.

Migrating reports can be time-consuming. But it also presents the opportunity to review your report library and assess which reports you actually need and which ones you can retire. Rather than get overwhelmed with the prospect of assessing and moving your reports, let us help you.

Revelwood’s report conversion service consists of:

  • Conversion – We’ll convert your Excel reports from TM1 Perspectives to PAx. We’ll work with you to make sure the new reports look the way you want them to look, execute correctly, and render as Websheets where appropriate. We’ll use our own tools we’ve developed, specifically designed to streamline the conversion process. We’ll also make sure you have easy access to all the reports in your report library.
  • Optimization – Over time reports tend to become laden with too much information, or, on the flip slide, missing data elements. They also end up with hidden hard-coded values, errors, and performance issues. Our Report Conversion service includes automating and optimizing for accuracy and improved performance. You’ll save time and eliminate errors in your ongoing reporting process.
  • Rationalization – We’ll work with you to rationalize your reporting strategy. Together we’ll determine which reports you need and which reports can be combined to save time and effort. We’ll decide which reports need to be rendered in Planning Analytics Workspace (PAW) and accessed via a browser, instead of in Excel. We’ll also help you determine if Quick Reports and/or Explorations should be used instead of the traditional DBRW-style reports from TM1.
  • Education – We’ll make you self-sufficient in creating and maintaining PAx reports going forward! Our team will train you on PAx, with an emphasis on how to build well-designed, dynamic financial reports that leverage the best of both Planning Analytics and Excel.

Migrating your existing reports to Planning Analytics presents a unique opportunity to assess your reporting strategy, optimize and streamline your reports. Don’t just migrate your reports wholesale. Let us help you convert and make the most out of your reports.

Questions? Just drop me an email!

Home » IBM Planning Analytics » Page 29

Filed Under: News & Events Tagged With: Financial Performance Management, IBM Cognos TM1, IBM Planning Analytics, PAW, PAx, PAx reports, Planning Analytics for Excel, Planning Analytics Workspace, report conversion services, Revelwood, TM1, TM1 Perspectives, TM1 web

IBM Planning Analytics Tips & Tricks: The New Set Editor

October 15, 2019 by Lee Lazarow Leave a Comment

Tips & Tricks

IBM Planning Analytics contains a new set editor that makes it easy to manipulate the elements in a subset. This approach allows you to quickly add a single element, add a group of elements, or replace an existing set of elements.

Once inside the set editor, you will see three buttons that are used to move elements from the left “selectable” side to the right “selected” side:

IBM Planning Analytics Tips & Tricks: PA Set Editor

The first step is to define the insertion approach. This approach allows you to enter a single element (member only) or a set of elements. These options include the following:

Using the IBM Planning Analytics Set Editor

Once an approach is defined, you can either append to the existing set or you can replace the existing set. Assume we start with the following layout:

How to use the IBM Planning Analytics Set Editor

Inserting the children of 2017 will result in the following set:

Learn how to use the IBM Planning Analytics set editor

This approach added the 2017 element and the immediate children to the existing set.

Replacing the children of 2017 will result in the following set:

Using the new set editor in IBM Planning Analytics

This approach removed the 2016 elements and replaced them with the immediate children of 2017.

This new approach in Planning Analytics will save you time by merging multiple steps into a single click.

IBM Planning Analytics, which TM1 is the engine for, is full of new features and functionality. Not sure where to start? Our team here at Revelwood can help. Contact us for more information at info@revelwood.com. And stay tuned for more Planning Analytics Tips & Tricks weekly in our Knowledge Center and in upcoming newsletters!

Read more IBM Planning Analytics Tips & Tricks

IBM Planning Analytics Tips & Tricks: PA Modeling – The Setting Editor

IBM Planning Analytics Tips & Tricks: PA Modeling – The Dimensions Editor

IBM Planning Analytics Tips & Tricks: The Planning Analytics Workspace Editor – Part I

IBM Planning Analytics Tips & Tricks: The Planning Analytics Workspace Editor – Part II

Home » IBM Planning Analytics » Page 29

Filed Under: IBM Planning Analytics Tips & Tricks Tagged With: Analytics, Beyond Budgeting, Budgeting, Budgeting Planning & Forecasting, Financial Performance Management, IBM Cognos TM1, IBM Planning Analytics, Planning & Forecasting, Planning & Reporting, planning analytics new features, TM1

IBM Planning Analytics Tips & Tricks Video: Bookmarks in IBM Planning Analytics Workspace

October 8, 2019 by Lisa Minneci Leave a Comment

Tips & Tricks

In our latest IBM Planning Analytics Tips & Tricks video, Revelwood’s FP&A Technical Director, Lee Lazarow explains and demonstrates how bookmarks work in IBM Planning Analytics Workspace (PAW). Bookmarks in PAW are quick and easy to use and make a big difference when navigating through many items in Planning Analytics.

Watch Bookmarking in IBM Planning Analytics and learn:

  • How to add or remove a bookmark
  • How bookmarks are used to quickly move to a certain spot
  • How bookmarks are used to go to a specific view

IBM Planning Analytics, which TM1 is the engine for, is full of new features and functionality. Not sure where to start? Our team here at Revelwood can help. Contact us for more information at info@revelwood.com. And stay tuned for more Planning Analytics Tips & Tricks weekly in our Knowledge Center and in upcoming newsletters!

Watch other videos in our IBM Planning Analytics Tips & Tricks series:

Regions with Rules in IBM Planning Analytics

Creating Dimensions in IBM Planning Analytics

Creating Dashboards in IBM Planning Analytics

Creating a Cube in IBM Planning Analytics

Home » IBM Planning Analytics » Page 29

Filed Under: IBM Planning Analytics Tips & Tricks, Videos Tagged With: Analytics, bookmkarking in PAW, Budgeting Planning & Forecasting, Financial Performance Management, IBM Cognos TM1, IBM Planning Analytics, Planning & Forecasting, Planning & Reporting, planning analytics tips & tricks video, Planning Analytics video, Planning Analytics Workspace, TM1

Understanding PVUs

October 3, 2019 by John Pra Sisto Leave a Comment

News & Events

“A Processor Value Unit (PVU) is a unit of measure used to differentiate licensing of software on distributed processor technologies (defined by Processor Vendor, Brand, Type and Model Number). IBM continues to define a processor, for purposes of PVU-based licensing, to be each processor core on a chip (socket).”

So what does this mean in English? Basically, a PVU is unit of measure assigned to various hardware chips that allows IBM to assess a licensing cost for the power of that machine. As the hardware for your On-Premise IBM Planning Analytics systems become more powerful, the cost to license that power goes up. PVUs are licensed for both Production and Non Production (dev/ test) environments so it is important to ensure that you have both up to date.

Why is this important?

PVUs change as hardware changes thus making it important to stay up to date in order to remain compliant with license guidelines. If you bought 200 PVUs for your system 5 years ago, it’s a safe bet that there has been a hardware refresh at some point since then. If this created an increase in hardware power you must increase your PVUs to pass an IBM audit. For many clients, PVUs become the forgotten license.

It’s easy to understand users. If you add more people to the system then you know to add user licenses, but PVUs tend to be passed over. It’s important to stay informed so you remain compliant.

How do you know what is needed?

PVUs are calculated and displayed here : IBM PVU Chart

They are the result of an IBM calculation based on three things:

  1. The Chip family
  2. # of sockets
  3. # of cores

Example:

For this example, let’s assume that you have the following hardware makeup;

TEST TM1 – (1) socket, (2) Core Intel Xeon CPU E5-2670 v3 – Total 2 cores

PROD-1 TM1 – (4) socket, (2) Core Intel Xeon CPU E5-2670 v3 – Total 8 cores

PROD-2 TM1 – (2) socket, (2) Core Intel Xeon CPU E5-2670 v3 – Total 4 cores

Based on this info and the PVU table below:

IBM Planning Analytics Tips & Tricks: Understanding PVUs

Test – 1 socket/2 cores = 70 PVUs per core or a total of 140 needed

Prod1 – 4 sockets/8 cores = 100 PVUs per core or a total of 800 needed

Prod2 – 2 sockets/4 cores = 70 PVUs per core or a total of 280 needed.

The total PVUs needed for Non Prod = 140

The total PVUs needed for Prod = 1080

PVUs are often an afterthought when thinking about licensing. It’s important to understand the need to maintain a current count in both your Prod and Non Prod environments or risk a large penalty if you are audited.

Home » IBM Planning Analytics » Page 29

Filed Under: News & Events Tagged With: Analytics, Beyond Budgeting, Budgeting, Budgeting Planning & Forecasting, Financial Performance Management, IBM Cognos TM1, IBM Planning Analytics, Planning & Forecasting, Planning & Reporting, TM1

IBM Planning Analytics Tips & Tricks: Cell Level Security Defaults

October 1, 2019 by Lee Lazarow Leave a Comment

Tips & Tricks

Did you know that you can have TM1 / Planning Analytics security always use your cell security definitions … even when the security definition cell is blank?

Values in a cell security cube override all other security. But if an intersection in the cell security cube is blank then, by default, other definitions such as cube, element and dimension security will be used.

In TM1 version 10.2, a new cube was created that allows you to override this approach. The cube is called }CubeSecurityProperties and it contains a setting called CELLSECURITYDEFAULTVALUE. The initial setting is blank, which allows the standard approach of “use the other definitions” to still apply.  However, you can change this approach by populating a value into the cube.

If you change the value in the }CubeSecurityProperties cube then all cells with an empty value in the cell security cube will use that setting. Values in the }CubeSecurityProperties cube can be set to NONE, READ or WRITE.

In the example below, blank cell security intersections will be set to READ

IBM Planning Analytics Tips & Tricks: Cell Security Defaults

When using this, be sure to think about any ripple effects associated with your existing security. For example, if you set a cube to READ then you will need to explicitly set cells to NONE that you don’t want users to see (whereas it may have already defaulted to NONE before the cube was populated).

This approach gives you more options to determine how cell security interacts with the rest of your security model.

IBM Planning Analytics, which TM1 is the engine for, is full of new features and functionality. Not sure where to start? Our team here at Revelwood can help. Contact us for more information at info@revelwood.com. And stay tuned for more Planning Analytics Tips & Tricks weekly in our Knowledge Center and in upcoming newsletters!

Read more IBM Planning Analytics Tips & Tricks:

IBM Planning Analytics Tips & Tricks: PA Modeling – The Settings Editor

IBM Planning Analytics Tips & Tricks: Creating Dynamic, Attractive Dashboards

IBM Planning Analytics Tips & Tricks: Preventative Maintenance to Maximize TM1 Performance

Home » IBM Planning Analytics » Page 29

Filed Under: IBM Planning Analytics Tips & Tricks Tagged With: Analytics, Beyond Budgeting, Budgeting, Budgeting Planning & Forecasting, Financial Performance Management, IBM Cognos TM1, IBM Planning Analytics, Planning & Forecasting, Planning & Reporting, TM1

New Video Series: IBM Planning Analytics Tips & Tricks

September 24, 2019 by Lisa Minneci Leave a Comment

Tips & Tricks

Every Tuesday we publish written blog posts sharing IBM Planning Analytics Tips & Tricks from our PSG team. Today, we’re adding to our tips & tricks with a series of videos!

Watch this short video from FP&A Technology Director, Lee Lazarow, to learn what regions are, and how and why you’ll want to use them in Planning Analytics.

You’ll see and hear Lee explain:

  • Why regions are different from comments
  • How to create regions
  • How to shrink and expand regions

The best part about regions is that they enable quick and easy navigation!

IBM Planning Analytics, which TM1 is the engine for, is full of new features and functionality. Not sure where to start? Our team here at Revelwood can help. Contact us for more information at info@revelwood.com. And stay tuned for more Planning Analytics Tips & Tricks weekly in our Knowledge Center and in upcoming newsletters!

Home » IBM Planning Analytics » Page 29

Filed Under: IBM Planning Analytics Tips & Tricks, Videos Tagged With: Analytics, Beyond Budgeting, Budgeting, Budgeting Planning & Forecasting, demo, Financial Performance Management, IBM Cognos TM1, IBM Planning Analytics, Planning & Forecasting, Planning & Reporting, TM1, video

New Video Demo – Creating Dashboards in IBM Planning Analytics

September 18, 2019 by Lisa Minneci Leave a Comment

Video

In the third video of our series Creating a Cube in IBM Planning Analytics, Revelwood’s FP&A Technology Director, Lee Lazarow, demonstrates how to create a dashboard in IBM Planning Analytics. Watch this short video demo to learn how to create a dashboard from the sales cube built in the second video, using both a drag and drop methodology and Planning Analytics’ built-in wizard.

In this video, Lee demonstrates the results of sales commissions in the dashboard, as well as how to:

  • Change views
  • Create simplistic views of data for quick analysis
  • Visualize a set of numbers
  • Build different types of charts
  • Merge separate sets of data

Lee also demonstrates Planning Analytics’ built-in intelligence that shows which charts are best for your particular data.

Did you miss the first two videos in this series? Watch Creating Dimensions Planning Analytics and Creating a Cube in Planning Analytics.

Subscribe to our YouTube Channel and follow our playlist to watch the entire series How to Create a Cube in IBM Planning Analytics.

Home » IBM Planning Analytics » Page 29

Filed Under: IBM Planning Analytics Tips & Tricks, Videos Tagged With: Analytics, Budgeting, Budgeting Planning & Forecasting, dashboarding, dashboards, Financial Performance Management, IBM Cognos TM1, IBM Planning Analytics, Planning & Forecasting, Planning & Reporting, TM1

IBM Planning Analytics Tips & Tricks: Blank Rows in Active Form Reports

September 17, 2019 by Lee Lazarow Leave a Comment

Tips & Tricks

Did you know when creating active form reports, you may sometimes want to separate sections? Some people like to create this separation via dashes or via bold line formatting. Some prefer to create “dummy” elements and use conditional formatting to make them appear like a blank line (although this approach is not recommended). Many clients, however, prefer to have the separation via a blank line.

Unfortunately, there is no easy way to create a blank line. We instead used a different approach with a client to create separation within rows in an Excel-based report.

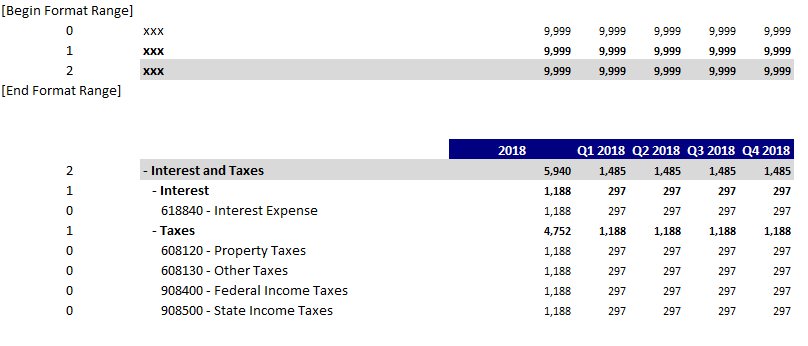
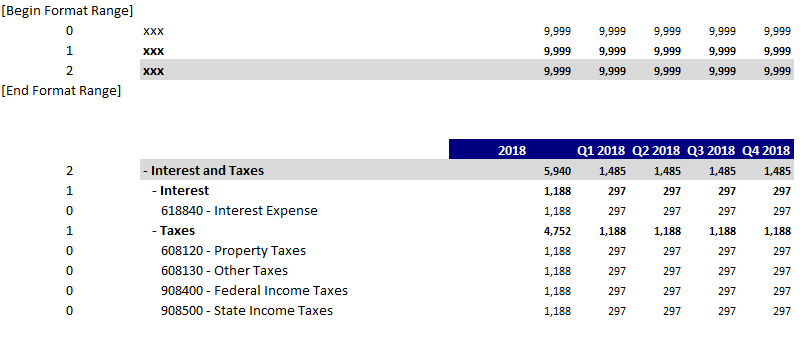
Here is a sample report that we will start with, including the formatting range:

IBM Planning Analytics Tips & Tricks: Blank Rows in Active Form Reports

Column 1 references the element level of the account. This is the column that will be used for the formatting. The rest of the report is a standard active form. 

We now want to insert a blank area above the level 1 elements (e.g., above the line for Interest and above the line for Taxes).

Step 1: Insert a new column and edit the formatting for the applicable level

  • We will insert a new column to the left of the year
  • We will then format the new column for level 1 to have a very large font.  This report is currently set to use font size 11, so we will set this one cell to use font size 22.

Here is the new formatting area:

Blank Rows in Active Form Reports

Step 2: Within the report, hard code a value into the new column

  • Type the letter X into the new column. Remember that you only need to put the letter into the top row since Active Forms will replicate the value when you rebuild the report.

Here is the report after rebuilding it:

IBM Planning Analytics Tips: Blank Rows in Active Form Reports

There are now blank areas surrounding the rows associated with level 1, but the new formatting is only associated with the one column. 

Step 3: Hide the new column

  • In addition to hiding the column, you may choose to also manipulate the vertical cell alignment.

Once completed, here is the final report that users will see:

IBM Planning Analytics Tricks: Blank Rows in Active Form Reports

This approach uses formatting to create separation between rows within Excel. When combined with conditional formatting and other references in the first column (e.g. the format definition column), this approach can be both very powerful and very flexible.

IBM Planning Analytics, which TM1 is the engine for, is full of new features and functionality. Not sure where to start? Our team here at Revelwood can help. Contact us for more information at info@revelwood.com. And stay tuned for more Planning Analytics Tips & Tricks weekly in our Knowledge Center and in upcoming newsletters!

Learn more IBM Planning Analytics Tips & Tricks:

IBM Planning Analytics Tips & Tricks: The Ranked Report

IBM Planning Analytics Tips & Tricks: Snap Commands – Spelling

IBM Planning Analytics Tips & Tricks: Snap Commands – Sorting

Need more guidance? Take a look at our IBM Planning Analytics Training services and our Customer Care Program.

Home » IBM Planning Analytics » Page 29

Filed Under: IBM Planning Analytics Tips & Tricks Tagged With: Analytics, Budgeting, Budgeting Planning & Forecasting, Financial Performance Management, IBM Planning Analytics, Planning & Reporting, TM1

IBM Planning Analytics Tips & Tricks: Preventative Maintenance to Maximize TM1 Performance

September 3, 2019 by Lee Lazarow Leave a Comment

Tips & Tricks

Did you know doing some preventative maintenance can maximize TM1 performance? How often do you do preventative maintenance? Probably not often enough. If you are like most TM1 admins, you probably have a list of urgent and vital projects you need to complete before the 2019 budgeting and planning season begins. Chances are, preventative maintenance on your TM1 system won’t make it to the top of your to-do list.

Think of your TM1 environment the way you think of your car. You know regular oil changes, standard mileage-milestone checkups, and rotating your tires helps to make your car run better and helps to stave off critical issues. While you likely get these services done on your car, you probably don’t do them yourself. So why spend time you don’t have on vital performance tasks for your TM1 environment? Instead, let the team of TM1 experts at Revelwood do the work for you.

How do you might benefit from a TM1 health check? Ask yourself if your system is exhibiting any of these symptoms of a less-than-optimal environment:

  • Your TM1 system is running slower than you want it to
  • Your TM1 reports are taking too long to generate
  • You want to get a better understanding of the components in your TM1 environment and how they are linked together
  • You’ve hired new staff who would like more knowledge about your unique TM1 system.

For a limited time we’re offering a one-day complimentary health check on your TM1 system. Our process consists of:

  • A review of your system architecture
  • An analysis of your cubes and rules
  • An examination of your Turbo Integrator processes to see how efficient they are
  • Recommendations on how to optimize your reports
  • Recommendations on things you can do to improve the security of your TM1 environment.

IBM Planning Analytics is full of new features and functionality. Not sure where to start? Our team here at Revelwood can help. Contact us for more information at info@revelwood.com. And stay tuned for more Planning Analytics Tips & Tricks weekly in our Knowledge Center and in upcoming newsletters!

Home » IBM Planning Analytics » Page 29

Filed Under: IBM Planning Analytics Tips & Tricks Tagged With: Customer Care program, Financial Performance Management, IBM Planning Analytics, TM1

  • « Go to Previous Page
  • Page 1
  • Interim pages omitted …
  • Page 27
  • Page 28
  • Page 29
  • Page 30
  • Page 31
  • Interim pages omitted …
  • Page 41
  • Go to Next Page »

Footer

Revelwood Overview

Revelwood helps finance organizations close, consolidate, plan, monitor and analyze business performance. As experts in solutions for the Office of Finance, we partner with best-in-breed software companies by applying best practices guidance and our pre-configured applications to help businesses achieve their full potential.

EXPERTISE

  • Workday Adaptive Planning
  • IBM Planning Analytics
  • BlackLine

ABOUT

  • Who We Are
  • What We Do
  • How We Help
  • How We Think
  • Privacy

CONNECT

World Headquarters

Florham Park, NJ | 201 984 3030

European Headquarters

London & Edinburgh | +44 (0)131 240 3866

Latin America Office

Miami, FL | 201 987 4198

Email
info@revelwood.com

Copyright © 2025 · Revelwood Inc. All rights reserved. Revelwood® and the Revelwood logo are registered marks of Revelwood Inc.