Did you know IBM Planning Analytics offers more than one way to add calculations to your data?
The great thing about using Planning Analytics within Excel is that you can add additional calculations to your data set to help you further analyze your data. Did you know that you can also do this within PAW explorations?
Use the following steps to create a new calculation:
- Select one or more elements within your exploration. The elements can be from either the row or column axis.
- Right click on a selected element
- Choose the option to “create calculation”.
Planning analytics will then provide you with a set of pre-built calculations to choose from. The calculations available vary according to the number of members selected.
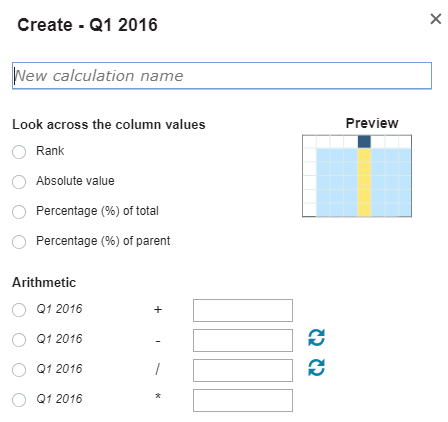
If you select one element, you will have options such as absolute value and percentage of total:
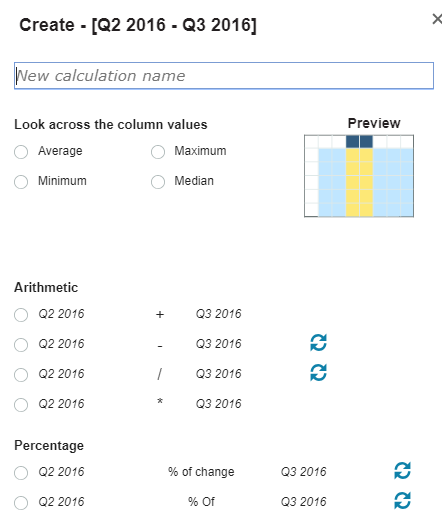
If you select two elements, you will have options such as variance amount and percentage change:
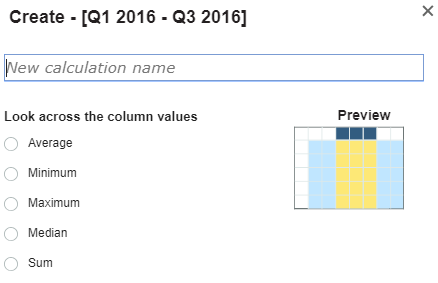
If you select three or more elements, you will have options such as average amount and maximum value:
Once created, you have the option to rename or remove any calculations within your exploration.
IBM Planning Analytics, which TM1 is the engine for, is full of new features and functionality. Not sure where to start? Our team here at Revelwood can help. Contact us for more information at info@revelwood.com. And stay tuned for more Planning Analytics Tips & Tricks weekly in our Knowledge Center and in upcoming newsletters!
Learn more IBM Planning Analytics Tips & Tricks:
IBM Planning Analytics Tips & Tricks: Creating Selectors in Planning Analytics Workspace
IBM Planning Analytics Tips & Tricks: Creating Buttons in Planning Analytics Workspace
IBM Planning Analytics Tips & Tricks: Synchronizing Selectors in Planning Analytics Workspace