This is a guest post from Revelwood’s Shane Bethea.
Did you know there is a new interface in IBM Planning Analytics? You may have used TM1Top or TM1 Operations Console in the past with TM1 and wondered if something new replaced those tools in Planning Analytics. The answer is yes. The new interface that has been introduced in Planning Analytics called Planning Analytics Administration (PAA). It is accessible to administrators via PA Workspace (PAW). Note: At the time of this writing, PAA is only available in the IBM cloud version of Planning Analytics.
PAA combines features from TM1Top and Operations Console and then adds many new features on top of it. Administrators can use the PAA dashboard to monitor the health of the overall Planning Analytics environment and also oversee each individual TM1/Planning Analytics server running within the environment.
The interface is customizable and lets you set safe/concern/critical thresholds for things like blocked threads, memory usage, CPU usage, and disk usage. Once certain critical levels are reached, email alerts can be configured to inform system administrators of the problem.
Other features of the PAA dashboard include the ability to:
- Start/stop/restart TM1/PA servers
- View/cancel long running threads
- Disconnect users
- Change tm1s.cfg configuration settings
- Set up and maintain Secure Gateway connections
- Download error logs from the TM1/PA environment
- Download documentation (installation guide, new features, fix list)
- Download the latest version of Planning Analytics for Excel (PAx)
To access the Planning Analytics Administration dashboard, login to your PAW environment and click the Administration tile in the top right corner.
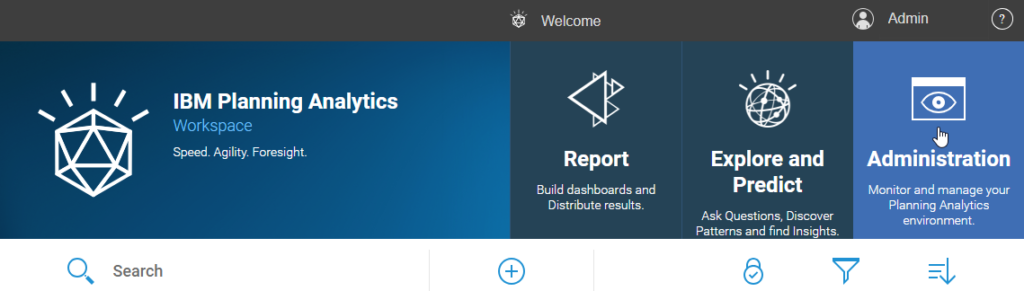
The main dashboard will show the overall health of the environment and display a tile for each running and stopped TM1/PA server. Note: Throughout the interface, green means safe, yellow means concern, and red means critical.
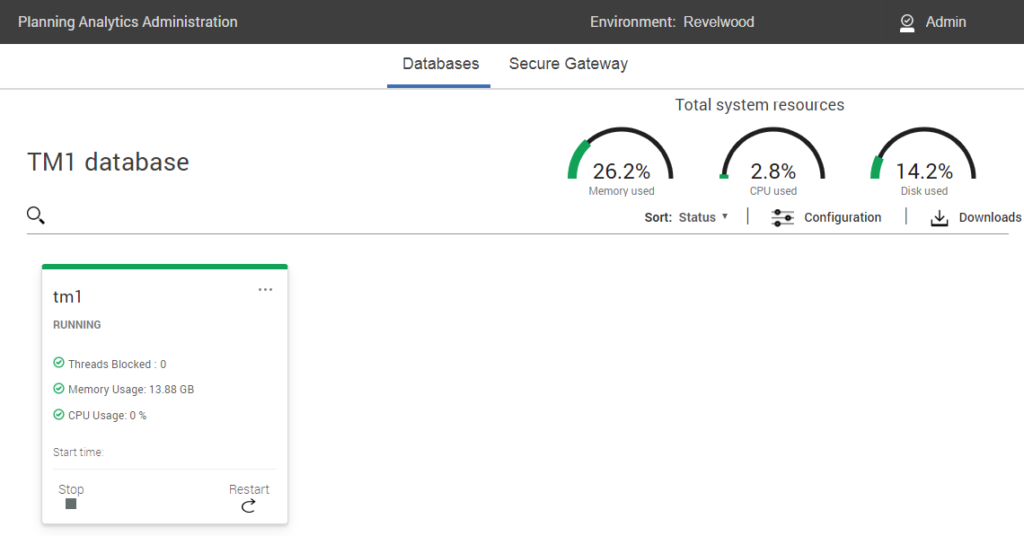
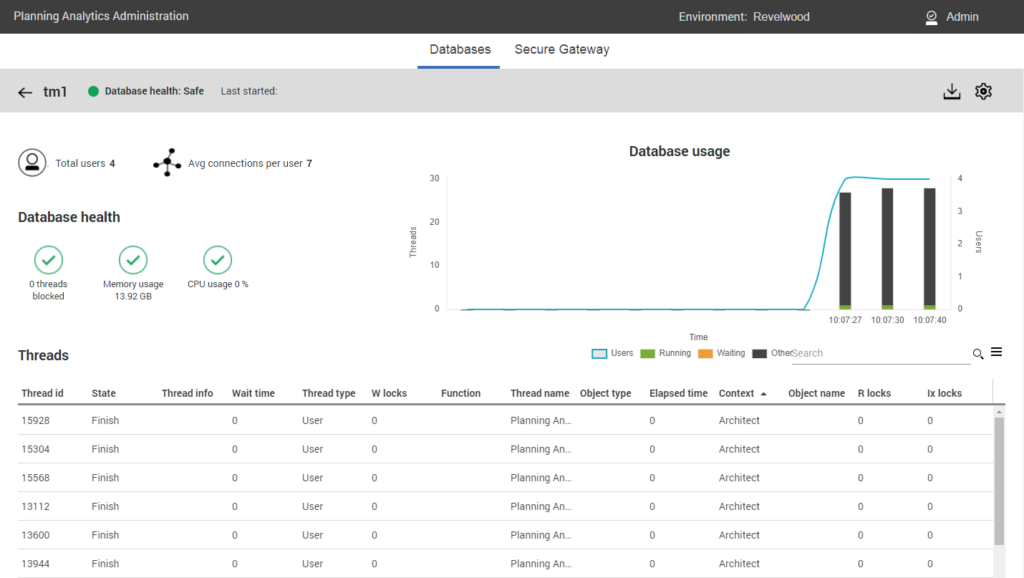
You can click on the name of an individual TM1/PA server and see a more detailed view of that server.
This is a simple overview of the Planning Analytics Administration dashboard. Stay tuned for more detailed entries.
IBM Planning Analytics is full of new features and functionality. Not sure where to start? Our team here at Revelwood can help. Contact us for more information at info@revelwood.com. And stay tuned for more Planning Analytics Tips & Tricks weekly in our Knowledge Center and in upcoming newsletters!
Read more IBM Planning Analytics Tips & Tricks:
IBM Planning Analytics Tips & Tricks: Setting Default Members
IBM Planning Analytics Tips & Tricks: Using Excel to get Client Information
IBM Planning Analytics Tips & Tricks: Duplicating Sheets