Have you ever written a TurboIntegrator (TI) script that used a manually uploaded file as a source? If so, this requires a two-step process: upload the file and then run the script. As long as you remember to follow both steps, the process will work great. But what if you forget to upload a new file? (insert your own “misremember” joke here!).
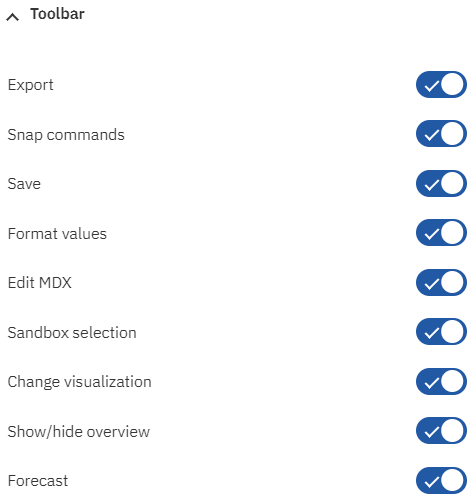
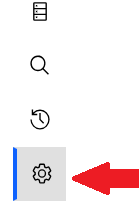
IBM Planning Analytics Workspace (PAW) action buttons can resolve this situation for you by using the Allow File Upload setting within the Properties, Configure area.

When this setting is enabled, a File Upload window will appear before the process is run.

By having the button prompt you for a file, it will be easier to ensure that the script is using the data that you need for the process.
Revelwood is an IBM Gold Business Partner with 25+ years of experience designing, developing, implementing and maintaining IBM Planning Analytics environments. Revelwood has helped clients in all sizes across all industries optimize and grow their use of Planning Analytics. Revelwood’s Planning Analytics team consists of experienced PA experts, including a multi-year IBM Champion.
Stay up to date with PA – sign up for our weekly Planning Analytics Tips & Tricks newsletter, subscribe to our YouTube channel, and join our IBM Planning Analytics All-Stars group on LinkedIn.
Read more IBM Planning Analytics Tips & Tricks:
IBM Planning Analytics Workspace Settings: DIM Editor Page Size
IBM Planning Analytics Workspace Settings – Dim Editor Index
IBM Planning Analytics Tips & Tricks: Application Websheet Folders