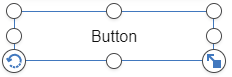
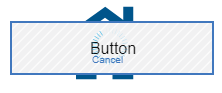
Action buttons in IBM Planning Analytics are a great utility that allow users to recalculate a sheet, navigate to another location, or run a TurboIntegrator process. As your models evolve, you may need to periodically revise your templates to maintain their functionality. This sometimes include the action buttons.
In Perspectives, updating an action button was as simple as right-clicking on it and selecting the Properties option. In Planning Analytics, the approach is a little different.
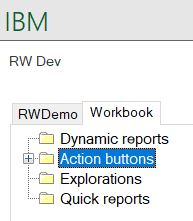
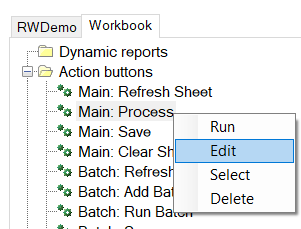
From the task pane, click on the tab labeled “Workbook.”
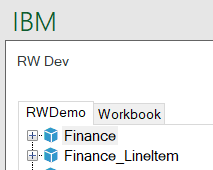
This section will show you all the different Planning Analytics objects that exist in your workbook. Expand the folder labeled “Action buttons.”
The name of each action button will be prefixed with the sheet name in which it is located. Find the action button that you’d like to edit, right-click it and select the “Edit” option.
This will open the properties window where you can make changes to the action button.

This approach will allow you to quickly edit all of your action buttons at the same time instead of having to navigate through your workbook and search for each button.
IBM Planning Analytics, which TM1 is the engine for, is full of new features and functionality. Not sure where to start? Our team here at Revelwood can help. Contact us for more information at info@revelwood.com. And stay tuned for more Planning Analytics Tips & Tricks weekly in our Knowledge Center and in upcoming newsletters! You can also sign up to get our Planning Analytics Tips & Tricks sent directly to your inbox!
Read more IBM Planning Analytics Tips & Tricks:
IBM Planning Analytics Tips & Tricks: Merge an Icon and a Button, Part 1
IBM Planning Analytics Tips & Tricks: Merge an Icon and a Button, Part 2
IBM Planning Analytics Tips & Tricks: Creating Buttons in IBM Planning Analytics Workspace (PAW)