Did you know that IBM Planning Analytics dimensions can have defined types and that these defined types are necessary for certain Planning Analytics features to operate correctly? For example, the new predictive forecasting functionality within Planning Analytics Workspace (PAW) requires the use of a designated Time dimension.
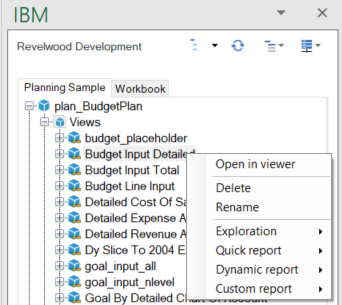
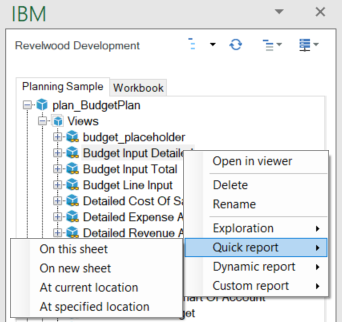
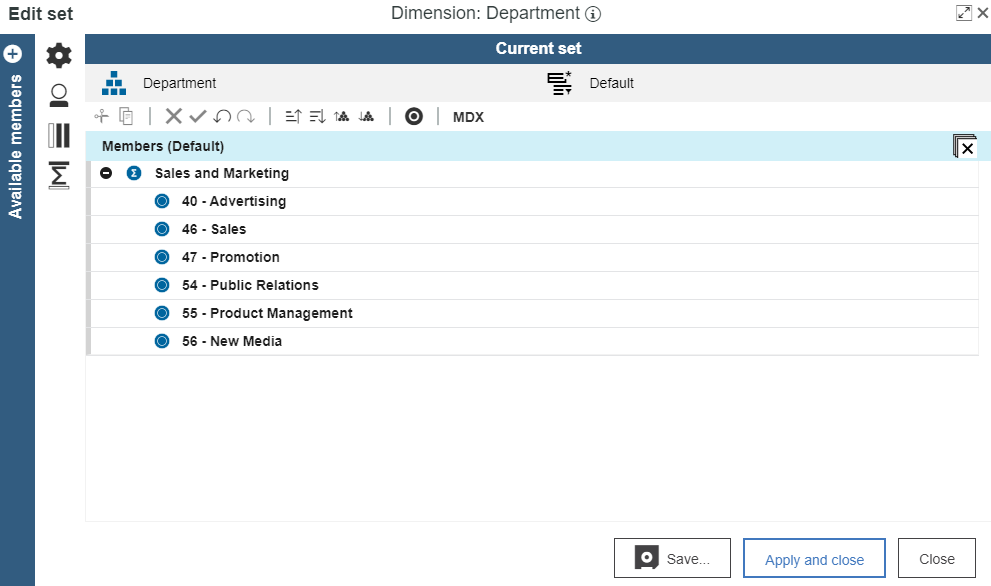
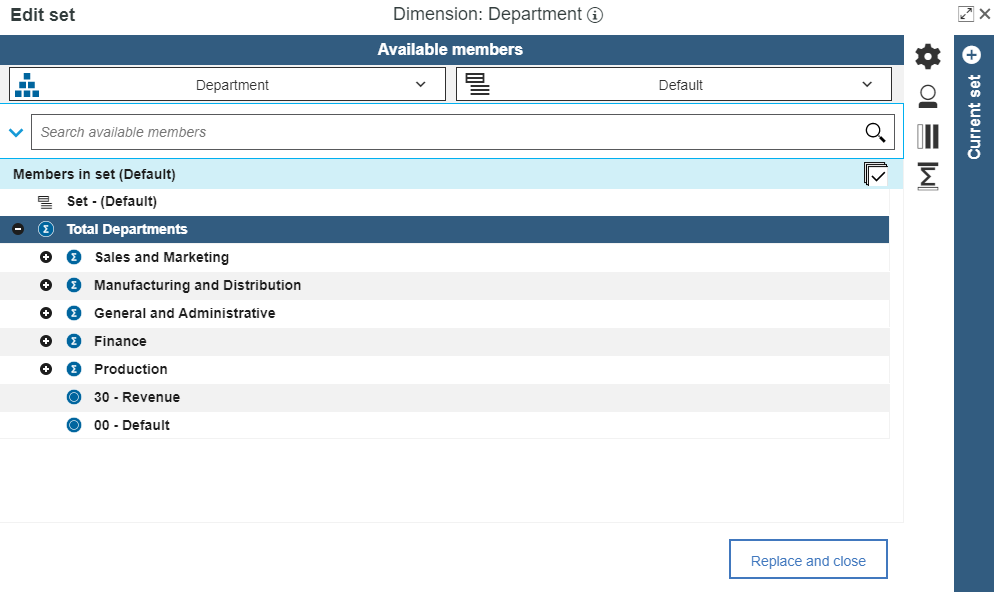
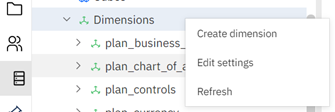
To view your dimension definitions in Planning Analytics Workspace, right-click on Dimensions and click “Edit settings” from the context menu.
The dimensions view will open in Dimensions Security Mode. To see the dimension types, switch to Dimensions Attributes Mode.
Attributes for each dimension are then presented. Not every dimension needs to have a defined dimension type, but some dimensions need to be defined to use specific functionality. The following types can be defined:
- GEOGRAPHY – Used in Planning Analytics Workspace to allow the visualization of your data using geographic maps.
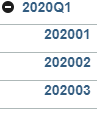
- TIME – Contains specified and recognized intervals of time utilized within a budgeting, planning, forecasting, and reporting structure.
- CALCULATION – Contains formulas used to perform intended operations against your data.
- METRIC – Contains a group or groups of elements that will be used to measure a business’s Key Performance Indicators (KPI’s).
- METRIC INDICATORS – Provides further information in relation to Key Performance Indicators (KPI’s), an example of this is trend.
- VERSIONS – Contains data from multiple uses of an element, such as current budget for a department for this year compared against the department’s budgets for prior years.
- GENERIC – Used when there is no precise type of dimension type required. These general members can include things like products and customers. Please note this can be changed at any point if you determine the dimension should have had or needs to be a defined type.
- HIERARCHY – This type of dimension is representative of the business reporting structure and can be used in tandem with workflow within an application.
This approach can be used with functionality associated with visualizations, predictive modeling, and other uses of Planning Analytics.
IBM Planning Analytics, which TM1 is the engine for, is full of new features and functionality. Not sure where to start? Our team here at Revelwood can help. Contact us for more information at info@revelwood.com. And stay tuned for more Planning Analytics Tips & Tricks weekly in our Knowledge Center and in upcoming newsletters!
Read more IBM Planning Analytics Tips & Tricks:
IBM Planning Analytics Tips & Tricks: PA Modeling – The Dimension Editor
IBM Planning Analytics Tips & Tricks: Simplifying Dimension Maintenance
IBM Planning Analytics Tips & Tricks: Subset Control Dimension