• Skip to main content
  • Skip to footer
Revelwood Logo

Revelwood

Your SUPER-powered WP Engine Site

  • Who We Are
    • About Us
      • Our Company
      • Our Team
      • Partners
    • Careers
      • Join Our Team
  • What We Do
    • Solutions
      • Workday Adaptive Planning
      • IBM Planning Analytics
      • BlackLine
    • Services
      • Implementation Services
      • Customer Care
        • Help Desk
        • System Administration as a Service
      • Training
        • Workday Adaptive Planning Training
        • IBM Planning Analytics / TM1 Training
    • Products
      • DataMaestro
      • LightSpeed
      • IBM Planning Analytics Utilities
  • How We Help
    • Use Cases
    • Client Success Stories
  • How We Think
    • Knowledge Center
    • Events
    • News
  • Contact Us

Revelwood

IBM Planning Analytics Tips & Tricks: Minimizing the Subset Area

November 3, 2020 by Lee Lazarow Leave a Comment

Tips & Tricks

Are your member names long and hard to see in the subset editor in IBM Planning Analytics? Does it get confusing to see both the available members and the current set at the same time? Both situations can be solved by hiding one side of the subset editor.

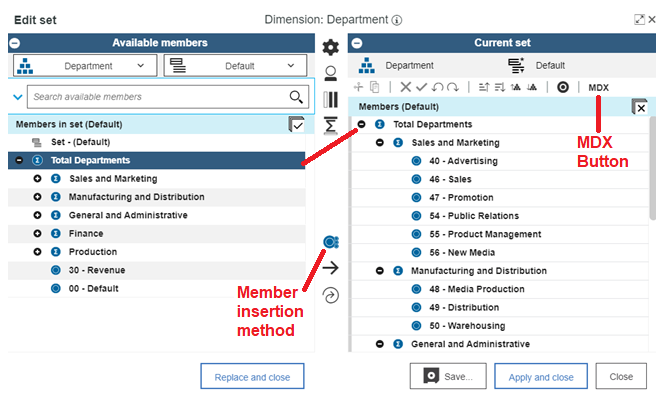
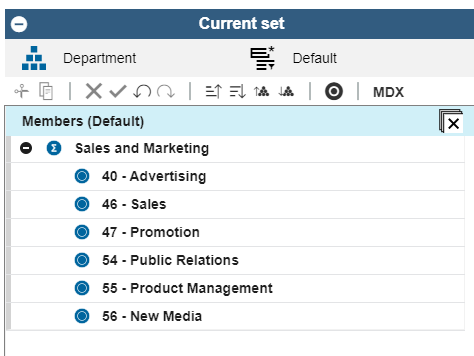
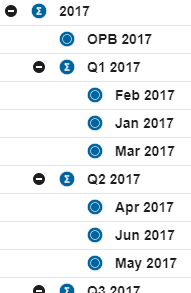
Here is an example of the subset editor which shows both the available members and the current set.

IBM Planning Analytics Tips & Tricks: Minimizing the Subset Area

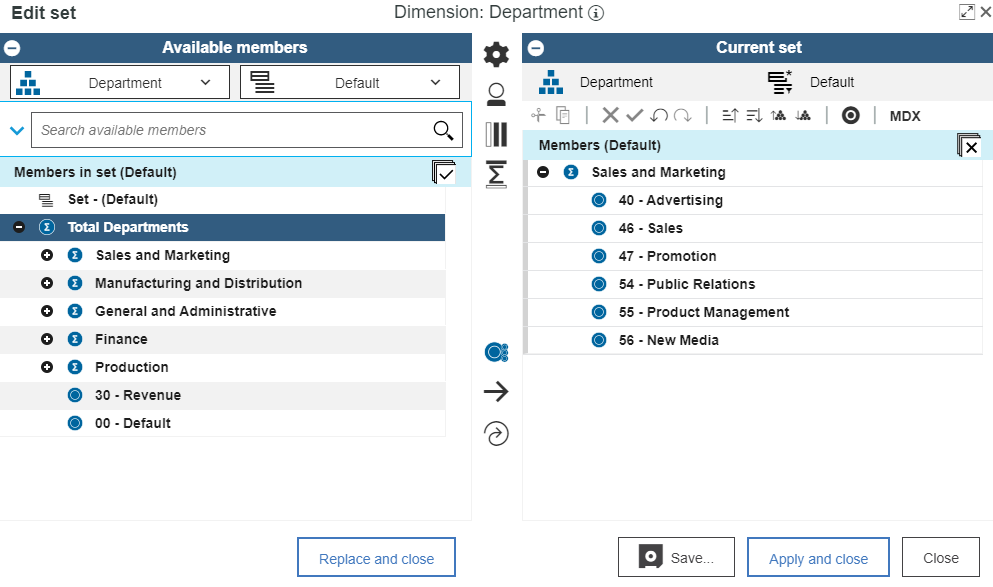
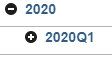
Each of the two sections has an option to minimize the area. This is done by clicking on the minus symbol at the top of the applicable section.

IBM Planning Analytics: Minimizing the Subset Area

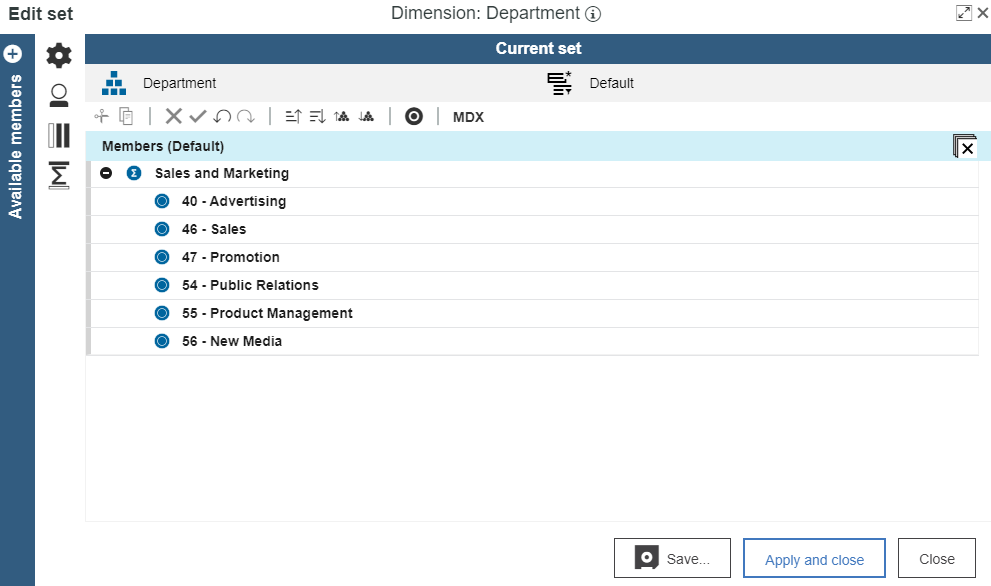
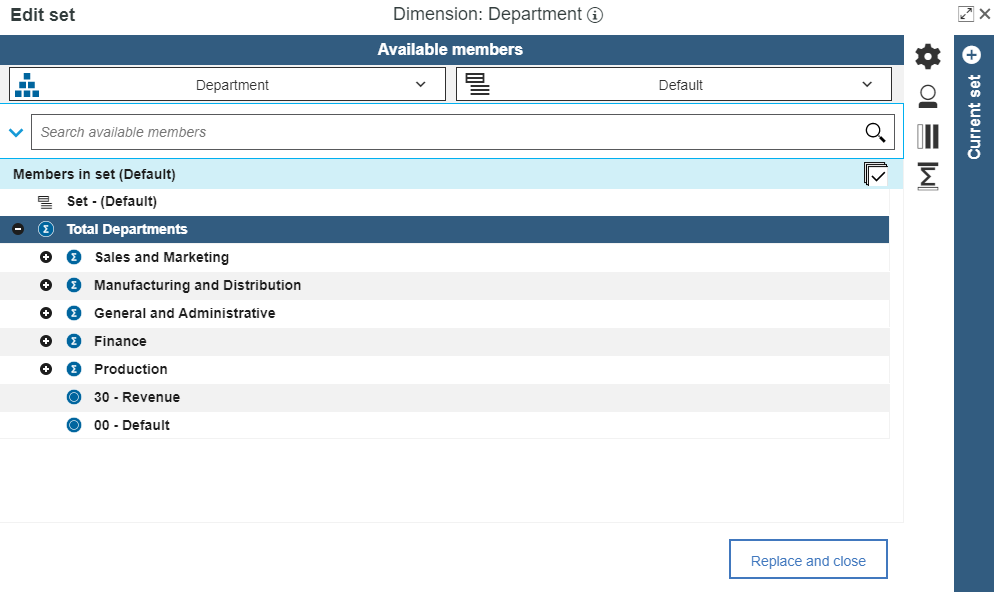
Once clicked, the applicable area will compress and the other area will expand. Note that you can only minimize one side at a time. Below are examples of what each screen will look like when compressed.

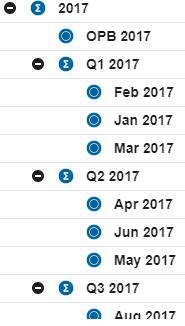
Minimized Available Members:

IBM Planning Analytics Tips: Minimizing the Subsea Area

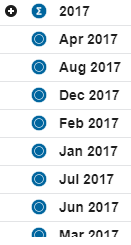
Minimized Current Set:

Minimizing the subset area in IBM Planning Analytics

This approach will allow you to further customize your subset editor screen to allow you to focus only on the area you want to see.

IBM Planning Analytics, which TM1 is the engine for, is full of new features and functionality. Not sure where to start? Our team here at Revelwood can help. Contact us for more information at info@revelwood.com. And stay tuned for more Planning Analytics Tips & Tricks weekly in our Knowledge Center and in upcoming newsletters!

Read more IBM Planning Analytics Tips & Tricks:

IBM Planning Analytics Tips & Tricks: Maintaining Subset-Drive Consolidations

IBM Planning Analytics Tips & Tricks: Sort Elements within a Subset

IBM Planning Analytics Tips & Tricks: Subset Control Dimension

Home » Revelwood » Page 2

Filed Under: IBM Planning Analytics Tips & Tricks Tagged With: Analytics, Budgeting Planning & Forecasting, Financial Performance Management, IBM Cognos TM1, IBM Planning Analytics, lee lazarow, Planning & Forecasting, Planning & Reporting, Planning Analytics Tips & Tricks, Revelwood, TM1

IBM Planning Analytics Tips & Tricks: Show Members

October 27, 2020 by Lee Lazarow Leave a Comment

Tips & Tricks

Did you know that while you are doing dimension maintenance, you can quickly view an element’s parents or children in IBM Planning Analytics Workspace (PAW) via a single click? Here’s how you can do this:

Step 1: Select the dimension to be edited. This is done by either right clicking on a dimension and selecting the option to “Edit Dimension” or by dragging the dimension onto a sheet.

Step 2: Right click on an element and select the option to “Show Member.” You will then see two sub-options: one for Parents and one for Children.

IBM Planning Analytics Tips & Tricks: Show Members
  • If you select the option for Parents then you will see all of the parents associated with the selected element. In this example, there is only one parent within the dimension structure.
Show members in IBM Planning Analytics
  • If you select the option for Children then you will see all of the children associated with the selected element. In this example, there are three elements in the consolidation.
How to show members in IBM Planning Analytics

Once defined, you can then perform dimension maintenance to each of the elements on your screen.

This approach allows you to easily traverse up or down your dimension while minimizing the amount of extra elements on the screen.

IBM Planning Analytics, which TM1 is the engine for, is full of new features and functionality. Not sure where to start? Our team here at Revelwood can help. Contact us for more information at info@revelwood.com. And stay tuned for more Planning Analytics Tips & Tricks weekly in our Knowledge Center and in upcoming newsletters!

Read more IBM Planning Analytics Tips & Tricks:

IBM Planning Analytics Tips & Tricks: Sort Elements within a Subset

IBM Planning Analytics Tips & Tricks: Editing Chores While Active

IBM Planning Analytics Tips & Tricks: Creating Groups in PAW

Home » Revelwood » Page 2

Filed Under: IBM Planning Analytics Tips & Tricks Tagged With: Budgeting, Budgeting Planning & Forecasting, Financial Performance Management, IBM Cognos TM1, IBM Planning Analytics, lee lazarow, Planning & Forecasting, Planning & Reporting, Planning Analytics Tips & Tricks, Revelwood, TM1

IBM Planning Analytics Tips & Tricks: An Approach to Strengthening your MDX Skills

October 20, 2020 by Lee Lazarow Leave a Comment

Tips & Tricks

Are you new to IBM Planning Analytics and looking for a good way to learn about the various commands associated with MDX? The Planning Analytics subset editor offers a great way to teach you about MDX expressions that can be used to define elements within a dimension.

The example below shows the results of a subset that includes all descendants of Total Department. The subset was created by simply dragging Total Departments into the current set while having the member insertion defined as descendants.

IBM Planning Analytics Tips & Tricks: Subset MDX Button

Once created, I can see the MDX expression that is used by clicking the MDX button at the top, right corner of the screen. The resulting expression is:

IBM Planning Analytics Tips: Subset MDX button

However, this button is not only used to view your newly created MDX expressions. The button also allows you to edit the expression. In this case, I can change the root element to be Sales and Marketing by simply typing over the existing MDX expression.

IBM Planning Analytics Tricks: Subset MDX button

After clicking the OK button, the elements in the current set are updated.

Subset MDX button in IBM Planning Analytics

This approach can help you to learn the fundamentals of MDX expressions, which are helpful for many different components of Planning Analytics.

IBM Planning Analytics, which TM1 is the engine for, is full of new features and functionality. Not sure where to start? Our team here at Revelwood can help. Contact us for more information at info@revelwood.com. And stay tuned for more Planning Analytics Tips & Tricks weekly in our Knowledge Center and in upcoming newsletters!

Read more IBM Planning Analytics Tips & Tricks:

IBM Planning Analytics Tips & Tricks: Sort Elements Within a Subset

IBM Planning Analytics Tips & Tricks: Editing Chores While Active

IBM Planning Analytics Tips & Tricks: Creating Groups in PAW

Home » Revelwood » Page 2

Filed Under: IBM Planning Analytics Tips & Tricks Tagged With: Budgeting, Budgeting Planning & Forecasting, Financial Performance Management, IBM Cognos TM1, IBM Planning Analytics, lee lazarow, Planning & Forecasting, Planning & Reporting, Planning analytics + MDX, Planning Analytics Tips & Tricks, Revelwood, TM1

IBM Planning Analytics Workspace (PAW) Version 2.0.57 Release

October 16, 2020 by Lee Lazarow Leave a Comment

Tech Bulletins

IBM recently released Version 2.0.57 of Planning Analytics Workspace (PAW). Version 2.0.57 is currently offered as a local-only release and will soon be available on the cloud (as version 2.0.58). This update contains many significant changes, including both new functionality and a different look and feel.

Some of these changes include:

Overall Interface

An updated Planning Analytics Workspace user interface provides a more consistent experience with other IBM products. This includes a new home page that is customized for your role within PAW and new icons that can be used to simplify the user experience.

Planning Analytics Workspace_v2.0.57

Predictive Forecasting

The introduction of Predictive forecasting allows you to easily model trends, seasonality, and time dependence in your data. If you are familiar with time series modeling then you can view details associated with the model type, model parameters, and accuracy measures. If you are not familiar with time series modeling, then AI driven model selection and tuning will assist you. The resulting data will provide both forecasted values and confidence boundaries.

IBM Planning Analytics Workspace (PAW) v2.0.57

New Organizational Approaches

Applications help you easily group together PAW assets such as books, views, and websheets. This approach can be used to help you organize assets in ways related to the structure of your organization. This is like the legacy Applications folder that exists in TM1.

IBM releases Planning Analytics Workspace v2.0.57

New Workflow Approaches

Plans allow an administrator to create a step by step walk through of your business processes. This will help end users better understand and follow the steps within your process. This will also minimize the times for users to find their required reports and templates.

Learn about IBM Planning Analytics Workspace (PAW) v2.0.57

Book and Visualization Improvements

New properties and drag-and-drop approaches give you more control over the objects within a book while still offering an easy way to create each component. IBM has also expanded the available set of visualizations, including the addition of waterfall charts and multi-line column charts.

Get info on IBM Planning Analytics Workspace (PAW) v2.0.57

Updated Administration

An updated administration page allows you to quickly see an overview of your databases, users, and groups on a single page.

Understanding IBM Planning Analytics Workspace (PAW) v2.0.57

The Ability to Enable the New Features

Version 58 will allow administrators and users to preview the new features.  Administrators will be able to enable preview mode and users will be able to “Return to Classic Experience.” Books created in the classic experience can be opened in the new experience and users can then use a “Save As” approach to update books with the new features.

Tech Bulletin: IBM Planning Analytics Workspace (PAW) v2.0.57

Further details about these new items can be found on IBM’s website.

If you have questions or would like to speak with us about these changes, please contact John Pra Sisto at jprasisto@revelwood.com.

Home » Revelwood » Page 2

Filed Under: Tech Bulletins Tagged With: Financial Performance Management, IBM Cognos TM1, IBM PAW, IBM PAW v 2.0.57, IBM planning analytics tech bulletin, IBM Planning Analytics Workspace, IBM Planning Analytics Workspace v 2.0.57, lee lazarow, Revelwood, tech bulletin, TM1

IBM Planning Analytics Tips & Tricks Video: The Aggregate Function

October 13, 2020 by Lisa Minneci Leave a Comment

Videos

Watch our latest IBM Planning Analytics Tips & Tricks video to learn about the aggregate function. Lee Lazarow, Revelwood’s FP&A Technology director, demonstrates this new function that allows you to summarize values that cannot be added up or averaged.

You’ll see Lee create a simple view of net income, examining some of the details associated with opex. He looks at it for multiple companies and for a total. Lee explains how one set of data is from the original numbers that your planners input into Planning Analytics. That data is doing a standard roll-up.

The second set of data is for a calculation of the percentage of net income. Lee demonstrates what you should do if you don’t want to look at the pre-built consolidation, but instead want to look at only some of the companies. He walks you through how to create your own calculation.

You’ll learn how to make sure this calculation is not a sum calculation, but instead how to leverage the aggregate function to summarize values such as percentages or ratios.

IBM Planning Analytics, which TM1 is the engine for, is full of new features and functionality. Not sure where to start? Our team here at Revelwood can help. Contact us for more information at info@revelwood.com. And stay tuned for more Planning Analytics Tips & Tricks weekly in our Knowledge Center and in upcoming newsletters!

Watch more IBM Planning Analytics Tips & Tricks videos:

IBM Planning Analytics Tips & Tricks Video: Drag & Drop Functionality

IBM Planning Analytics Tips & Tricks Video: Formatting Views in Planning Analytics Workspace

IBM Planning Analytics Tips & Tricks Video: Creating Multi-Level Dimensions

Home » Revelwood » Page 2

Filed Under: IBM Planning Analytics Tips & Tricks, Videos Tagged With: Financial Performance Management, IBM Cognos TM1, IBM Planning Analytics, Planning analytics + aggregate function, Planning Analytics Tips & Tricks, planning analytics tips & tricks video, Planning Analytics video, Revelwood, TM1

IBM Planning Analytics Tips & Tricks: Sort Elements within a Subset

October 6, 2020 by Lee Lazarow Leave a Comment

Tips & Tricks

Did you know that there are two different ways to sort elements within a subset in IBM Planning Analytics?

Below is an example of a subset which shows a standard time dimension:

Subset sort options in IBM Planning Analytics

One approach sorts all elements either ascending or descending, regardless of level. These are done via the following icons:

IBM Planning Analytics Tips & Tricks: Subset sort options

The result of this type of ascending sort will put all elements in alphabetical order, regardless of level:

Understanding subset sort options in IBM Planning Analytics

The other approach also sorts elements either ascending or descending, but this approach takes levels into consideration. These are done via the following icons:

Subset sort options in IBM Planning Analytics

The result of this type of ascending sort will put all elements in alphabetical order while keeping the levels intact:

Learn subset sort options in IBM Planning Analytics

This approach will allow you to sort your list of elements in various ways, which offers different opportunities based on the elements within the dimension.

IBM Planning Analytics, which TM1 is the engine for, is full of new features and functionality. Not sure where to start? Our team here at Revelwood can help. Contact us for more information at info@revelwood.com. And stay tuned for more Planning Analytics Tips & Tricks weekly in our Knowledge Center and in upcoming newsletters!

Read more IBM Planning Analytics Tips & Tricks:

IBM Planning Analytics Tips & Tricks: Editing Chores While Active

IBM Planning Analytics Tips & Tricks: Creating Groups in PAW

IBM Planning Analytics Tips & Tricks: Control Space

Home » Revelwood » Page 2

Filed Under: IBM Planning Analytics Tips & Tricks Tagged With: Budgeting, Budgeting Planning & Forecasting, Financial Performance Management, IBM Cognos TM1, IBM Planning Analytics, lee lazarow, Planning & Forecasting, Planning & Reporting, Planning Analytics Tips & Tricks, Revelwood, TM1

IBM Planning Analytics Tips & Tricks: Editing Chores While Active

September 29, 2020 by Lee Lazarow Leave a Comment

Did you know that IBM Planning Analytics Workspace (PAW) allows you to edit chores while they are active? Perspectives required you to de-activate a chore, make your modifications, and then re-activate it. However, the two “bookend” steps of this approach have been eliminated in the PAW environment.

To edit a chore, right click on the name of the chore and select the option to “Edit Chore.”

IBM Planning Analytics Tips & Tricks: Editing Chores

The chore will open to show you information about the chore.  You will then be able to edit the details associated with the schedule and the specific processes to run.

You have the option to disable the schedule at any time, but this is no longer a requirement.

Editing chores in IBM Planning Analytics Workspace

This approach allows you to quickly modify your chores without having to perform the mundane steps of de-activating it and then re-activating it. This also means that you no longer need to remember to turn the chore back on after making your changes!

IBM Planning Analytics, which TM1 is the engine for, is full of new features and functionality. Not sure where to start? Our team here at Revelwood can help. Contact us for more information at info@revelwood.com. And stay tuned for more Planning Analytics Tips & Tricks weekly in our Knowledge Center and in upcoming newsletters!

Read more IBM Planning Analytics Tips & Tricks:

IBM Planning Analytics Tips & Tricks: Home Button

IBM Planning Analytics Tips & Tricks: Edit Action Button

IBM Planning Analytics Tips & Tricks: Comparing Sandboxes

Home » Revelwood » Page 2

Filed Under: IBM Planning Analytics Tips & Tricks Tagged With: Analytics, Budgeting Planning & Forecasting, Financial Performance Management, IBM Cognos TM1, IBM Planning Analytics, lee lazarow, Planning & Forecasting, Planning & Reporting, Planning Analytics Tips & Tricks, Revelwood, TM1

IBM Planning Analytics Tips & Tricks: Creating Groups in PAW

September 22, 2020 by Lee Lazarow Leave a Comment

Did you know that you can create new groups and delete groups directly in IBM Planning Analytics Workspace (PAW)?  This is done within the dimension editor via the same screen that you use to edit dimensions and attributes.

Step 1: Select the dimension to be edited.  This is done by either right clicking on a dimension and selecting the option to “Edit Dimension” or by dragging the dimension onto a sheet.

Step 2: Switch to member security mode.  This is done by clicking the Member Security Mode icon:

IBM Planning Analytics Tips & Tricks: Creating Groups in PAW

Step 3: You can now modify groups by selecting the icon to either create or delete a group:

Creating groups in IBM Planning Analytics Workspace

If you choose the option to create a group then you will be prompted for the group name.

How to create groups in IBM Planning Analytics Workspace

Once created, you can then set security by right clicking on the applicable areas:

  • Right click on the group name to define security for all elements within the group
  • Right click on a specific element to define security only for that element

This approach will save you time by allowing you to perform all aspects of dimension maintenance within a single area.

IBM Planning Analytics, which TM1 is the engine for, is full of new features and functionality. Not sure where to start? Our team here at Revelwood can help. Contact us for more information at info@revelwood.com. And stay tuned for more Planning Analytics Tips & Tricks weekly in our Knowledge Center and in upcoming newsletters!

Read more IBM Planning Analytics Tips & Tricks:

IBM Planning Analytics Tips & Tricks: PAW Cell Comments

IBM Planning Analytics Tips & Tricks: New Features in PAW – Data Refresh

IBM Planning Analytics Tips & Tricks: PAW Pass Context

Home » Revelwood » Page 2

Filed Under: IBM Planning Analytics Tips & Tricks Tagged With: Analytics, Budgeting Planning & Forecasting, Financial Performance Management, IBM Cognos TM1, IBM Planning Analytics, lee lazarow, Planning & Forecasting, Planning & Reporting, planning analytics tips & tricks video, Revelwood, TM1

IBM Planning Analytics Tips & Tricks Video: Using Drag & Drop to Change Selector Elements in PAx Reports

September 15, 2020 by Lisa Minneci Leave a Comment

Video

In our latest IBM Planning Analytics Tips & Tricks video, Lee Lazarow, Revelwood’s FP&A technology director demonstrates how to change selector elements within IBM Planning Analytics for Excel (PAx) using drag and drop functionality. This new feature enables you to do this without having to open the set editor.

Watch this video and you’ll learn how to:

  • Select the element you want and drag it
  • Drag an existing set of elements to a selector

This approach enables Planning Analytics administrators the ability to change the values in a subset without having to train your users or learn anything about the subset editor.

IBM Planning Analytics, which TM1 is the engine for, is full of new features and functionality. Not sure where to start? Our team here at Revelwood can help. Contact us for more information at info@revelwood.com. And stay tuned for more Planning Analytics Tips & Tricks weekly in our Knowledge Center and in upcoming newsletters!

Watch more IBM Planning Analytics Tips & Tricks videos:

IBM Planning Analytics Tips & Tricks Video: Formatting Views in Planning Analytics Workspace

IBM Planning Analytics Tips & Tricks Video: Creating Multi-Level Dimensions

IBM Planning Analytics Tips & Tricks Video: The Hold Feature

Home » Revelwood » Page 2

Filed Under: IBM Planning Analytics Tips & Tricks, Videos Tagged With: Budgeting, Budgeting Planning & Forecasting, Financial Performance Management, IBM Cognos TM1, IBM Planning Analytics, lee lazarow, Planning & Forecasting, Planning & Reporting, Planning Analytics for Excel, Planning Analytics tips, Revelwood, TM1

  • « Go to Previous Page
  • Page 1
  • Page 2
  • Page 3
  • Page 4
  • Interim pages omitted …
  • Page 8
  • Go to Next Page »

Footer

Revelwood Overview

Revelwood helps finance organizations close, consolidate, plan, monitor and analyze business performance. As experts in solutions for the Office of Finance, we partner with best-in-breed software companies by applying best practices guidance and our pre-configured applications to help businesses achieve their full potential.

EXPERTISE

  • Workday Adaptive Planning
  • IBM Planning Analytics
  • BlackLine

ABOUT

  • Who We Are
  • What We Do
  • How We Help
  • How We Think
  • Privacy

CONNECT

World Headquarters

Florham Park, NJ | 201 984 3030

European Headquarters

London & Edinburgh | +44 (0)131 240 3866

Latin America Office

Miami, FL | 201 987 4198

Email
info@revelwood.com

Copyright © 2025 · Revelwood Inc. All rights reserved. Revelwood® and the Revelwood logo are registered marks of Revelwood Inc.