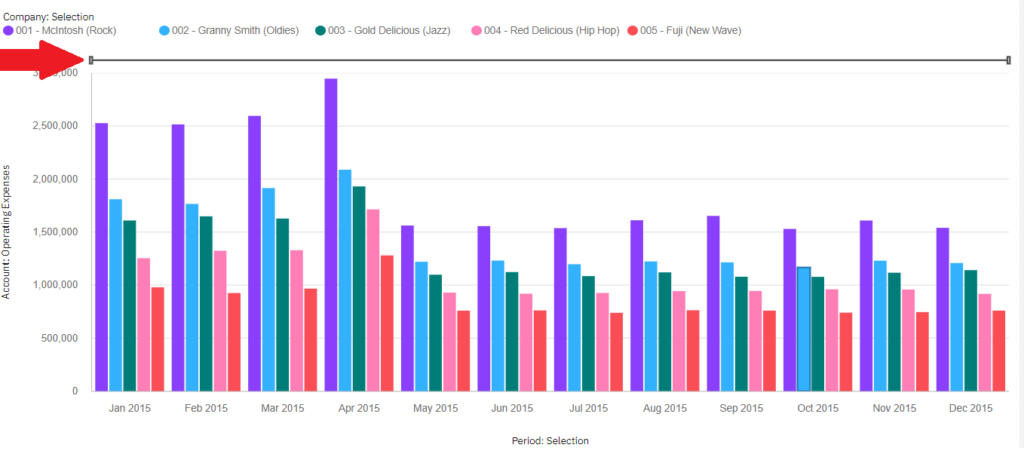
One of the strengths of OLAP tools like IBM Planning Analytics is that you can create data sets that stack multiple dimensions together. Planning Analytics Workspace (PAW) allows you to easily convert those data sets into an easy-to-read visualization. Here is an example of a column chart that shows historical expense data by both time and company.
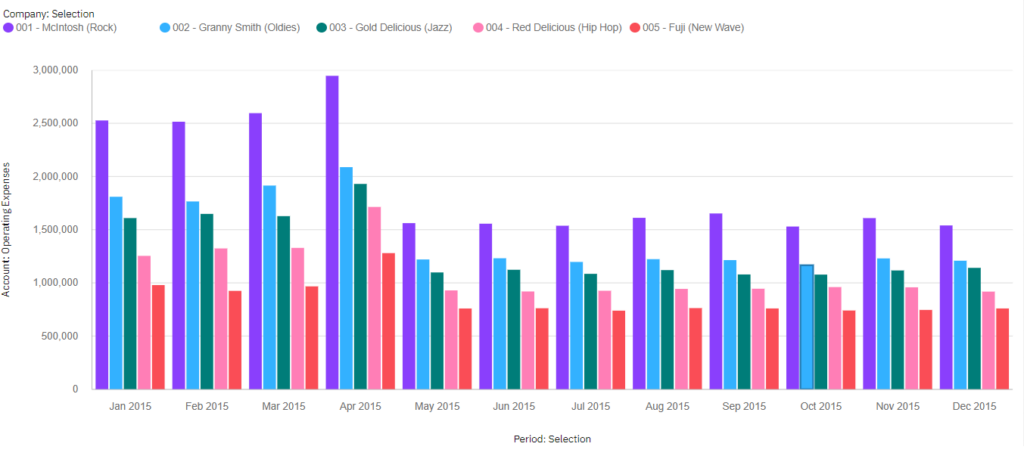
These charts can quickly become hard to read as you include more dimensions in your rows. To minimize this issue, PAW includes a feature to add a zoom bar to your line and column visualizations. This zoom bar lets you focus on a smaller area of the visualization.
The zoom option is enabled within the Chart section of the Properties.
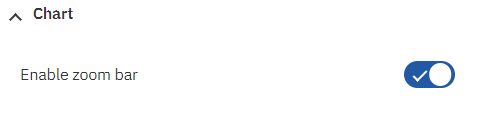
Once enabled, a scroll bar will appear on your chart.
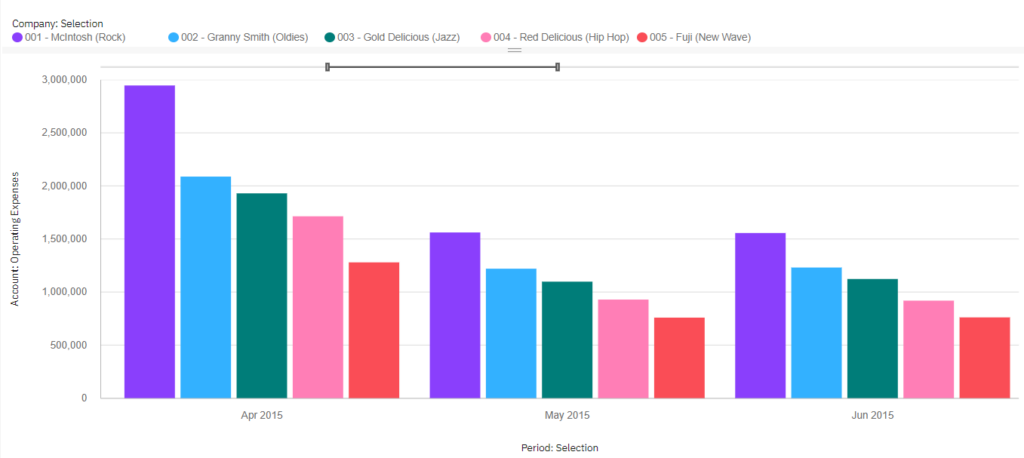
You can then drag the edges of the scroll bar to zoom into a specific area. Here is an example of the same chart with a focus on Quarter 2.
This approach will make your existing line and column charts more interactive and easier to use as you ask more questions about your existing data.
IBM Planning Analytics, which TM1 is the engine for, is full of new features and functionality. Not sure where to start? Our team here at Revelwood can help. Contact us for more information at info@revelwood.com. And stay tuned for more Planning Analytics Tips & Tricks weekly in our Knowledge Center and in upcoming newsletters!
Read more IBM Planning Analytics Tips & Tricks:
IBM Planning Analytics Tips & Tricks: Run TI Processes from PAx Task Pane
IBM Planning Analytics Tips & Tricks: TI Dimension Functions