• Skip to main content
  • Skip to footer
Revelwood Logo

Revelwood

Your SUPER-powered WP Engine Site

  • Who We Are
    • About Us
      • Our Company
      • Our Team
      • Partners
    • Careers
      • Join Our Team
  • What We Do
    • Solutions
      • Workday Adaptive Planning
      • IBM Planning Analytics
      • BlackLine
    • Services
      • Implementation Services
      • Customer Care
        • Help Desk
        • System Administration as a Service
      • Training
        • Workday Adaptive Planning Training
        • IBM Planning Analytics / TM1 Training
    • Products
      • DataMaestro
      • LightSpeed
      • IBM Planning Analytics Utilities
  • How We Help
    • Use Cases
    • Client Success Stories
  • How We Think
    • Knowledge Center
    • Events
    • News
  • Contact Us

TM1

Revelwood’s Top 15 IBM Planning Analytics Tips & Tricks of 2018, Part 2

February 5, 2019 by Lisa Minneci Leave a Comment

Tips & Tricks

Last week we published the first in a series of three blog posts highlighting our most widely read blogs of 2018. In today’s post, we showcase five more posts that were extremely popular with TM1 users & those Planning Analytics users who have already migrated from TM1.

  1. IBM Planning Analytics Tips & Tricks: Year-to-Date Hierarchies

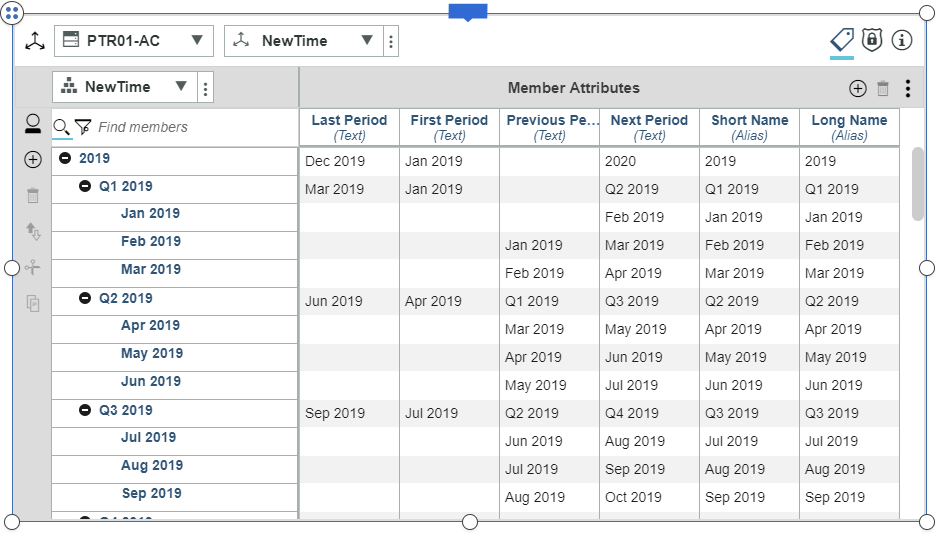
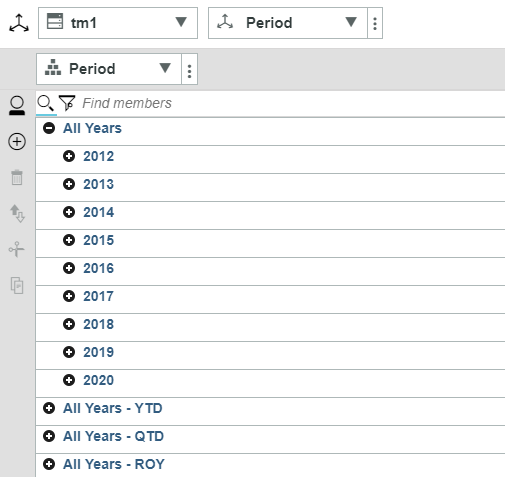
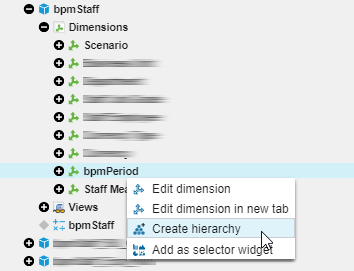
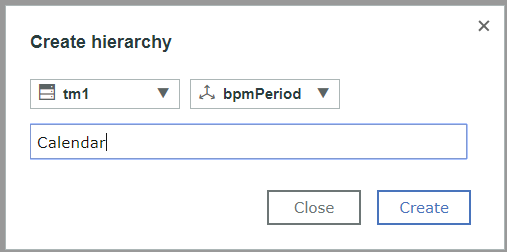
Learn how to create a single hierarchy that contains all year-to-date-values within an entire year. As you know, TM1 is a consolidation tool which is designed to sum together a series of values.  There are many ways to create the consolidations using a combination of grand totals and sub totals.  This blog post specifically addresses the year-to-date (YTD) hierarchy associated with a time dimension.

  1. IBM Planning Analytics Tips & Tricks: How to Make Action Button Messages Dynamic

Planning Analytics for Excel (PAx) and Perspectives allow you to customize action button messages. In fact, you can go further and make those messages dynamic. Read the full blog post to learn how to:

  • Set up cells in a PAx workbook for the custom messages
  • Edit an action button to use thee custom messages.
  1. IBM Planning Analytics Tips & Tricks: Using MDX to Compare Dimension Hierarchies

Learn how to use MDX to compare dimension hierarchies. Planning Analytics dimensions often have multiple hierarchies that should all roll up to the same total. Said another way, these separate hierarchies should all contain the same set of n-level elements below them. For example, a customer dimension may have a hierarchy for rolling up the “All Customers – by Type” and another for “All Customers – by Region.” A TurboIntegrator process can be used to maintain the elements in the dimension and these two hierarchies, but sometimes the two hierarchies may become out of sync. MDX can be used to see if both hierarchies contain the exact same number of n-level customers and, if the two hierarchies are out of sync, identify the elements causing the problem.

  1. IBM Planning Analytics Tips & Tricks: Planning Analytics Workspace (PAW) Chart Types

Charts and graphs are an excellent way to illustrate relationships in data and highlight trends. Planning Analytics Workspace allows end users to quickly analyze a large amount of data. To make the biggest impact, it is important to choose the right chart for the use case of the data. Read the full post to learn the different chart types available within Planning Analytics Workspace, and when one type might be better than another.

  1. IBM Planning Analytics Tips & Tricks: Planning Analytics for Excel (PAx) VBA API Calls

IBM Planning Analytics lets you make API calls through VBA in Planning Analytics for Microsoft Excel (PAx)? You probably know that action buttons can be used to refresh or rebuild reports in PAx. But what if you want to refresh the data in your report as part of a VBA routine? Maybe there are more tasks you want to perform through VBA and then you want to refresh the data as the last step. IBM offers the ability to make API calls through VBA in PAx with just a few steps.

Check back next week for the last five most popular blog posts of 2018.

Home » TM1 » Page 29

Filed Under: IBM Planning Analytics Tips & Tricks Tagged With: Analytics, Budgeting, Budgeting Planning & Forecasting, Financial Performance Management, IBM Planning Analytics, Planning & Reporting, TM1

Revelwood’s Top 15 IBM Planning Analytics Tips & Tricks of 2018, Part 1

January 29, 2019 by Lisa Minneci Leave a Comment

Tips & Tricks

Every Tuesday we publish a new IBM Planning Analytics Tips & Tricks blog post. Today’s post is the first in a series of three highlighting our 15 most popular blog posts of 2018.

  1. IBM Planning Analytics Tips & Tricks: The Ranked Report

IBM Planning Analytics for Microsoft Excel (PAx) provides several tools to view, maintain, and report on your Planning Analytics data. Dynamic Reports, one of the PAx reporting tools, allows you to create flexible reports with personalized formatting. An example of this is a ranked report, which will display and sort the top set of rows. Read the full blog post to learn how to insert a TM1RPTFILTER formula into a cell on the Excel worksheet containing the Dynamic Report.

  1. IBM Planning Analytics Tips & Tricks: Asymmetrical Axis in PAx

IBM Planning Analytics for Excel (PAx) gives you the ability to use an asymmetrical approach that allows you to display combinations of elements without the repetition. IBM Cognos TM1 and IBM Planning Analytics gives you the ability to quickly create views of your existing data.  The views are symmetrical, which means that any rows or columns that contain multiple elements will include all possible combinations of the selected elements.  But sometimes you may not want to see all combinations.

Read the full blog post for an example of a symmetrical view that will be converted into an asymmetrical view.  The example will use a Financial GL cube.

  1. IBM Planning Analytics Tips & Tricks: New Parameters for TurboIntegrator

IBM Planning Analytics enables you to create a temporary VIEW or SUBSET TurboIntegrator function. This blog post explains why you may need to, and how to do so. IBM has gone to great lengths to ensure that the transition to Planning Analytics is a seamless process and has added some new functionality to help make your system more efficient.

Two commonly used TurboIntegrator (TI) functions are SUBSETCREATE and VIEWCREATE.  These processes are used to create a new component in your process, but they sometimes can cause an issue.  If you create a new subset or view in the prolog but then have the process fail with the DATA tab then the process will end without removing the new components.  This is most likely because VIEWDESTROY and SUBSETDESTROY are most likely within the Epilog.

There are ways to code around this in the existing version of TM1, but Planning Analytics now offers the ability to create a temporary VIEW or SUBSET as of version 10.2.2 FP4.  This is done by adding a flag at the end of the command.

  1. IBM Planning Analytics Tips & Tricks: Ensuring Cube Logging is Reset in TM1

Did you know you can easily reset cube logging in TM1? A previous tech tip was written to discuss when to enable and disable logging. As stated in that posting, it is best practice to turn cube logging off while processing TurboIntegrator processes. Typically, logging is turned off in the Prolog and turned back on in the Epilog. But if an error occurs when the process is run, it never reaches the Epilog and logging never gets turned back on.

  1. IBM Planning Analytics Tips & Tricks: TM1 Web Write-back Protection

There are several ways to prevent data entry to TM1 in TM1 Web websheets. The first approach can be used for input templates. Use this approach when you want your users to be able to enter data for certain cells/columns, but not others. By default, every cell in an Excel worksheet has the ‘Locked’ property set. This property has no effect on the cell unless the sheet or workbook is protected. In this example, we can select certain cells of an input template to be enterable and certain cells to be locked down or protected. To unlock certain cells in the template, right click the cells and select Format Cells. In the Format Cells dialogue box, select the Protection tab, uncheck the Locked checkbox, and select OK. Read the full blog post to learn the details.

Come back next week to read about the next five most popular blog posts of 2018.

Home » TM1 » Page 29

Filed Under: IBM Planning Analytics Tips & Tricks Tagged With: Analytics, Budgeting, Budgeting Planning & Forecasting, Financial Performance Management, IBM Planning Analytics, Planning & Forecasting, Planning & Reporting, TM1

Revelwood’s Performance Tune-Up Is Live!

January 24, 2019 by Brian Combs Leave a Comment

News & Events

Revelwood’s Customer Care offering is now complete! I am excited to announce that the third prong in our suite of Customer Care services, the Performance Tune-Up, is ready to go. Our Performance Tune-Up, along with the other two services, System Administration as a Service and Help Desk, will make sure your TM1 or IBM Planning Analytics system doesn’t fail when you need it most. It’s all about providing you with the peace of mind that Revelwood has your back when you need us. You choose the level of service that fits you best and we take care of the rest.

While our goal is to make you self-sufficient with respect to your solution and processes, we understand that there are times where a second set of hands is very important. Whether you want us to handle all or part of your system administration or you want to take advantage of our “phone a friend” option or if you want recurring check points to ensure your system is continually tweaked and updated so it changes with your business, Revelwood has you covered. Now I want to focus a bit on our final Customer Care offering, the Performance Tune-Up.

To maintain peak performance levels, Revelwood offers recurring, scheduled maintenance of your Planning Analytics application. This is accomplished through a combination of interviews and detailed technical reviews of your cube models, business processes and technical environment. The Tune-Up includes Annual and Quarterly components which cover general technical and business topics that may affect the health of your system.

Annual Tune-Up services are completed once per year and focus on general business concerns/changes and the technical health of your overall solution. Quarterly Tune-Up services provide a deep dive into one model per quarter and focus on five key components which are measured across five overarching categories. Revelwood will review your model’s performance, maintainability, integrity, usability and security for your TurboIntegrator processes, entry templates, rules, model structure and reports.

Everyone knows that proper maintenance is the key to maintaining overall good health and performance. You don’t think twice about going to a mechanic for scheduled tune-ups or heading to your doctor for routine well visits. So why would you assume that your TM1/Planning Analytics solution will simply take care of itself?

With constant changes to your processes and system usage, how can you afford NOT to include Revelwood’s Performance Tune-Up as part of your normal maintenance routine? Without proper care and feeding, your solution may not be ready when you need it most. Don’t let your investment suffer a slow decline. Let Revelwood’s Performance Tune-Up offering help you ensure continued success tomorrow.

Home » TM1 » Page 29

Filed Under: IBM Planning Analytics Tips & Tricks, News & Events Tagged With: Analytics, Beyond Budgeting, Budgeting, Budgeting Planning & Forecasting, Customer Care program, Financial Performance Management, Help Desk, Performance Tune-Up, System Administration as a Service, TM1

New Customer Care Offering: System Administration as a Service for TM1 Users

January 23, 2019 by John Pra Sisto Leave a Comment

News & Events

As part of our expanded Customer Care program, we’ve recently launched a new System Administration as a Service (SAaaS) offering for TM1 users and IBM Planning Analytics users. This new program enables you to tap into our many years of experience, staff expertise and managed services infrastructure. We’ll free up your team from the labors of TM1 administration, while handling your general and cycle maintenance needs.

TM1 users and Planning Analytics users can chose from two options:

Fully Outsourced Coverage for TM1 Users

 We’ll take over your entire administration function. Our team will be fully responsible for ensuring your business cycles are managed from start to finish and that your TM1 environment or Planning Analytics environment is running in top condition. TM1 users will realize a number of benefits from this plan, including:

  • Reducing your SG&A expense
  • Allowing you to focus on your business and core competencies, rather than admin tasks
  • Eliminating the need for you to keep track of all the changes, patches, and updates from IBM
  • Providing uninterrupted service, freeing you from planning around vacations and unexpected absences

Backup/Supplemental Coverage for TM1 Users

We’ll serve as your extra set of hands when you need us. Whether its your busy season or you are taking vacation, we’re here so that your TM1 environment is always up and running. The benefits of this program include:

  • Access your expert technical staff when you need to
  • Augmenting your internal staff
  • Filling any skill or knowledge gaps
  • Ensuring continuity of business processes
  • Freeing your part-time admin to allow them to focus on their primary role
  • Gaining incremental assistance without adding incremental headcount

Our System Administration as a Service offering is one of several in our newly expanded Customer Care program. Our other Customer Care services include a Performance Tune-Up and a Help Desk offering.
Home » TM1 » Page 29

Filed Under: News & Events Tagged With: Analytics, Budgeting, Budgeting Planning & Forecasting, Customer Care program, Financial Performance Management, Help Desk, IBM Planning Analytics, Performance Tune-Up, TM1

IBM Planning Analytics Tips & Tricks: Navigate Back to the Source

January 22, 2019 by Lee Lazarow Leave a Comment

Tips & Tricks

Have you ever been in a situation where you are looking at an IBM Planning Analytics Workspace (PAW) view and quickly want to go back to that view? Did you know that PAW allows you to quickly navigate back to the source with a single click?

PAW allows you to easily define the database and cube associated with a cube view by pointing to the top, left corner of the view.

IBM Planning Analytics Tips & Tricks: Navigate back to the source

Once the view is selected, you can then click on the corner to go directly to the source cube.

IBM Planning Analytics Tips & Tricks: Navigating back to the source

This approach allows you to quickly navigate through your Planning Analytics environment with a single click.

IBM Planning Analytics is full of new features and functionality. Not sure where to start? Our team here at Revelwood can help. Contact us for more information at info@revelwood.com. And stay tuned for more Planning Analytics Tips & Tricks weekly in our Knowledge Center and in upcoming newsletters!

Read more blog posts in the IBM Planning Analytics Tips & Tricks Series:

IBM Planning Analytics Tips & Tricks: Creating Buttons in Planning Analytics Workspace (PAW)

IBM Planning Analytics Tips & Tricks: Customizing Planning Analytics Workspace (PAW) Directory Installation on Windows Server 2016

IBM Planning Analytics Tips & Tricks: Hiding Dimensions in Planning Analytics Workspace

Need more help? Learn about our Customer Care options for IBM Planning Analytics & TM1 users. 

Home » TM1 » Page 29

Filed Under: IBM Planning Analytics Tips & Tricks Tagged With: Analytics, Budgeting, Budgeting Planning & Forecasting, Financial Performance Management, IBM Planning Analytics, Planning & Forecasting, Planning & Reporting, TM1

IBM Planning Analytics Tips & Tricks: The Collect Feature in Planning Analytics Workspace

January 15, 2019 by Lee Lazarow Leave a Comment

Tips & Tricks

Did you know that you can easily copy Planning Analytics Workspace (PAW) components across sheets or books?

PAW allows you to use a feature called “Collect” that serves as the equivalent of copying. You can collect an item by selecting the item and then choosing the Collect option on the shortcut bar.

Learn about the collection feature in Planning Analytics Workspace

This option is available for views, visualizations, selectors, images, videos and other items on your PAW sheets.

Once collected, Planning Analytics will give you quick access to use the item again. You can view the items in your collection by selecting the collection button at the top, right corner of your screen and then choosing the option for Collection.

Understanding the collection feature in Planning Analytics Workspace

IBM Planning Analytics, which TM1 is the engine for, is full of new features and functionality. Not sure where to start? Our team here at Revelwood can help. Contact us for more information at info@revelwood.com. And stay tuned for more Planning Analytics Tips & Tricks weekly in our Knowledge Center and in upcoming newsletters!

Read more about Planning Analytics & Planning Analytics Workspace:

IBM Planning Analytics Tips & Tricks: Hiding Dimensions in Planning Analytics Workspace

IBM Planning Analytics Tips & Tricks: Creating Selectors in Planning Analytics Workspace

IBM Planning Analytics Tips & Tricks: Video Demo – Hierarchies in Planning Analytics Workspace

Home » TM1 » Page 29

Filed Under: IBM Planning Analytics Tips & Tricks Tagged With: Analytics, Budgeting, Budgeting Planning & Forecasting, Financial Performance Management, IBM Planning Analytics, Planning & Forecasting, Planning & Reporting, Planning Analytics Workspace, TM1

IBM Planning Analytics Tips & Tricks: Using Excel to get Client Information

January 8, 2019 by Lee Lazarow Leave a Comment

Tips & Tricks

Did you know that you can now easily define your client version of Planning Analytics via an Excel formula?

There are many ways to determine your version of Planning Analytics. Some of these approaches include reviewing log files, right clicking on executable files, or simply clicking on a Help/About option. Planning Analytics version 2.0.0 introduces an easy approach get your client information via the use of an Excel formula.

The formula TM1INFO can be used to return information about your current TM1 client version.  The syntax of the formula is:

TM1INFO(parameter)

The formula allows for a series of parameters:

clientversion

Returns the full client version number.

clientversionmajor

Returns the major client version number.

clientversionminor

Returns the minor client version number.

clientversionpatch

Returns fix pack and hotfix number.

For example, the formula =TM1INFO(“clientversionmajor”) may give you a result of 11 whereas  =TM1INFO(“clientversion”) would give a more detailed result of 11.0.00200.

This new approach gives you an easy way to monitor your client version and help ensure consistency throughout your organization.

IBM Planning Analytics is full of new features and functionality. Not sure where to start? Our team here at Revelwood can help. Contact us for more information at info@revelwood.com. And stay tuned for more Planning Analytics Tips & Tricks weekly in our Knowledge Center and in upcoming newsletters!

Read more IBM Planning Analytics Tips & Tricks from the Revelwood team:

IBM Planning Analytics Tips & Tricks: Writing Rules

IBM Planning Analytics Tips & Tricks: Recalculating Excel Worksheets

IBM Planning Analytics Tips & Tricks: Creating Dynamic Sets in the PAx Set Editor

Home » TM1 » Page 29

Filed Under: IBM Planning Analytics Tips & Tricks Tagged With: Analytics, Budgeting, Budgeting Planning & Forecasting, Financial Performance Management, IBM Planning Analytics, Planning & Forecasting, Planning & Reporting, TM1

IBM Planning Analytics Tips & Tricks: Compatibility of Views and Subsets

December 18, 2018 by Lee Lazarow Leave a Comment

Tips & Tricks

Did you know that your parameters for VIEWCREATE and SUBSCREATE must be in sync?

Earlier this year we wrote a blog post about a new parameter that can be used with both the VIEWCREATE function and the SUBSETCREATE function. This new parameter allows TurboIntegrator to create temporary components that are deleted when the script closes.

There is, however, an important rule about the compatibility of the settings:

Temporary subsets cannot be assigned to permanent views.

Since a temporary subset is never saved, TM1 will not recognize it as an existing subset. If you attempt to insert a temporary subset into a permanent view then you will receive an error. The error will state that the subset is not found within the dimension and your process will fail.

The new parameter adds value by helping to clean-up your code and by potentially improving performance, but it’s important to ensure the compatibility of each component.

IBM Planning Analytics, which TM1 is the engine for, is full of new features and functionality. Not sure where to start? Our team here at Revelwood can help. Contact us for more information at info@revelwood.com. And stay tuned for more Planning Analytics Tips & Tricks weekly in our Knowledge Center and in upcoming newsletters!

Learn more IBM Planning Analytics Tips & Tricks:

IBM Planning Analytics Tips & Tricks: New Parameters for TurboIntegrator

IBM Planning Analytics Tips & Tricks: Three Reserved Local Variables in TurboIntegrator

IBM Planning Analytics Tips & Tricks: TurboIntegrator Logging

Home » TM1 » Page 29

Filed Under: IBM Planning Analytics Tips & Tricks Tagged With: Analytics, Budgeting, Budgeting Planning & Forecasting, Financial Performance Management, IBM Planning Analytics, Planning & Reporting, TM1

IBM Planning Analytics Tips & Tricks: Creating Buttons in Planning Analytics Workspace (PAW)

December 11, 2018 by Revelwood Leave a Comment

Tips & Tricks

This is a guest post from Revelwood’s Shane Bethea.

Did you know there’s an easy way to create buttons that allow your users to switch sheets in IBM Planning Analytics Workspace (PAW)? For example, you’ve created multiple sheets in a PAW book and want to give your users the ability to switch back and forth between the different sheets. One simple way to do this is to create buttons on each sheet that point to other sheets.

To do this, click on the ‘create new button’ option at the top of your PAW window. This creates a new button on the sheet.

IBM Planning Analytics Tips & Tricks: Creating Buttons in PAW

Now you can use the Button properties menu at the top right of the PAW window to customize the button.

Learn how to create buttons in IBM Planning Analytics Workspace

You can edit the General style, such as the fill and border colors of the button.

How to create buttons in IBM Planning Analytics Workspace

You can edit Text properties, such as font style, size, and color.

IBM Planning Analytics Tips & Tricks: Learn how to create buttons in PAW

You can then edit the Button target, which will take the user to a sheet in the same book, a different book, or a hyperlink, such as your company’s intranet or some other website.

IBM Planning Analytics Tips & Tricks: Understanding how to create buttons in PAW

And finally, you can edit the Button text.

Creating buttons in IBM Planning Analytics Workspace

You now have a button on your sheet that points to another sheet in the same book. This approach can be used to easily link multiple sheets and to create easy-to-use navigation throughout your PAW environment.

IBM Planning Analytics is full of new features and functionality. Not sure where to start? Our team here at Revelwood can help. Contact us for more information at info@revelwood.com. And stay tuned for more Planning Analytics Tips & Tricks weekly in our Knowledge Center and in upcoming newsletters!

Get more IBM Planning Analytics Tips & Tricks:

IBM Planning Analytics Tips & Tricks: Creating Selectors in IBM Planning Analytics Workspace (PAW)

IBM Planning Analytics Tips & Tricks: Customizing PAW Directory Server on Windows 2016

IBM Planning Analytics Tips & Tricks: Hiding Dimensions in Planning Analytics Workspace (PAW)

Home » TM1 » Page 29

Filed Under: IBM Planning Analytics Tips & Tricks Tagged With: Analytics, Budgeting, Budgeting Planning & Forecasting, Financial Performance Management, Planning & Reporting, TM1

  • « Go to Previous Page
  • Page 1
  • Interim pages omitted …
  • Page 27
  • Page 28
  • Page 29
  • Page 30
  • Page 31
  • Interim pages omitted …
  • Page 37
  • Go to Next Page »

Footer

Revelwood Overview

Revelwood helps finance organizations close, consolidate, plan, monitor and analyze business performance. As experts in solutions for the Office of Finance, we partner with best-in-breed software companies by applying best practices guidance and our pre-configured applications to help businesses achieve their full potential.

EXPERTISE

  • Workday Adaptive Planning
  • IBM Planning Analytics
  • BlackLine

ABOUT

  • Who We Are
  • What We Do
  • How We Help
  • How We Think
  • Privacy

CONNECT

World Headquarters

Florham Park, NJ | 201 984 3030

European Headquarters

London & Edinburgh | +44 (0)131 240 3866

Latin America Office

Miami, FL | 201 987 4198

Email
info@revelwood.com

Copyright © 2025 · Revelwood Inc. All rights reserved. Revelwood® and the Revelwood logo are registered marks of Revelwood Inc.