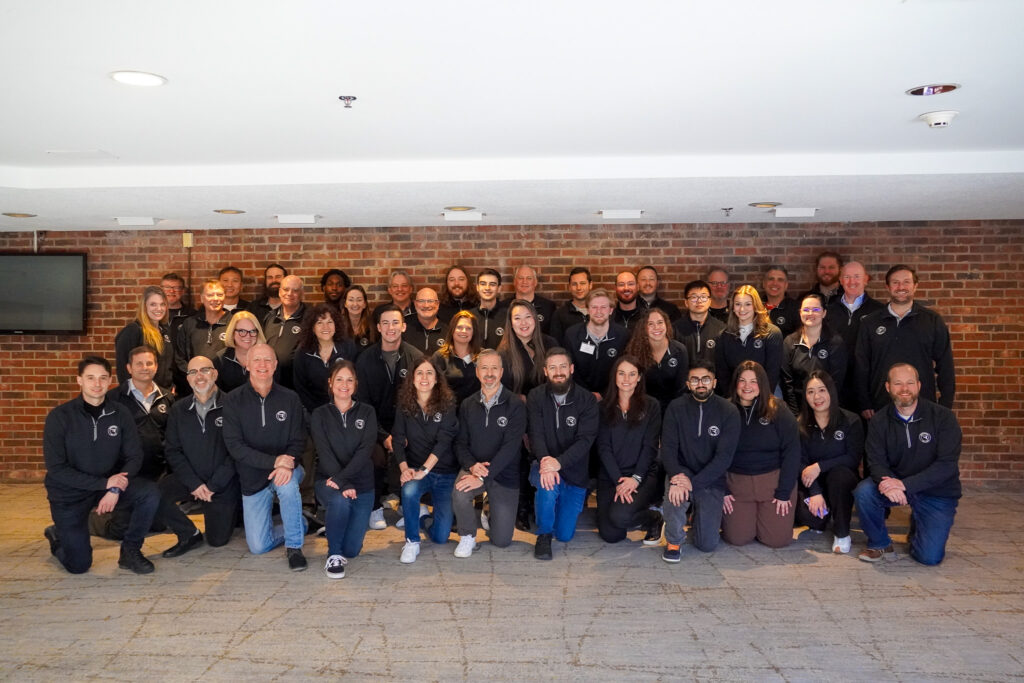
• Skip to main content
  • Skip to footer
Revelwood Logo

Revelwood

Your SUPER-powered WP Engine Site

  • Who We Are
    • About Us
      • Our Company
      • Our Team
      • Partners
    • Careers
      • Join Our Team
  • What We Do
    • Solutions
      • Workday Adaptive Planning
      • IBM Planning Analytics
      • BlackLine
    • Services
      • Implementation Services
      • Customer Care
        • Help Desk
        • System Administration as a Service
      • Training
        • Workday Adaptive Planning Training
        • IBM Planning Analytics / TM1 Training
    • Products
      • DataMaestro
      • LightSpeed
      • IBM Planning Analytics Utilities
  • How We Help
    • Use Cases
    • Client Success Stories
  • How We Think
    • Knowledge Center
    • Events
    • News
  • Contact Us

Workday Adaptive Planning

FP&A Done Right: 3 Pitfalls to Avoid with Rolling Forecasts

August 20, 2021 by Revelwood Leave a Comment

FP&A Done Right: Collaborate More When Planning

This is a guest blog post from our partner Workday Adaptive Planning, detailing three mistakes you don’t want to make with your rolling forecasts.

It’s not just meteorologists who can get forecasting wrong. If FP&A pros don’t take a thoughtful approach to establishing rolling forecasts, they can hit some unexpected stormy weather along the way. When that occurs, you run the risk of forecasts ending up, well, not being forecasts at all. They morph into updated versions of the annual budget as opposed to dynamic tools for creating visibility into the opportunities and challenges on the horizon.

Here are three pitfalls to avoid as you work to get the most strategic value out of forecasting and generate buy-in and momentum with your leadership team and business partners.

Pitfall #1: Don’t use the year-end as the stopping point

Let’s start with a driving analogy. Rolling forecasts should act like your headlights, providing steady and consistent visibility for what lies ahead. Too often, however, rolling forecasts become simply budget updates—which end up being the equivalent of driving so fast that the visibility provided by your headlights becomes increasingly limited.

The most common way organizations fall into this trap is by using the end of the year as a stopping point for forecasting. That may work in the first quarter, but by mid-year your forecast faces a hard stop in six months. And, of course, by the end of the third quarter you have a forecast that offers only three months of visibility.

When you’re forecasting with year-end being the stopping point, you’re just engaged in the process of determining if you are going to hit the year-end numbers that were established in the annual budget process.

The trouble with this approach is that it often encourages business partners to provide numbers and projections that are focused on “hitting the year-end numbers” as opposed to what is actually occurring in the business. With true rolling forecasts that don’t have an established endpoint you encourage transparency, because the focus is on assessing what is truly happening in your business and the market so you can plan and react accordingly. Not only that, but you can also generate a consistent long-range view to aid in better decision-making.

Pitfall #2: Know the difference between forecasts and targets

Forecast and targets are sometimes viewed as interchangeable. They’re not. In the simplest terms, a target is where you want to go, while the forecast continually tracks where you’re headed. In the ideal world, forecasts lead neatly toward your target. In the real world, a forecast represents the ever-changing dynamics of your business and the marketplace.

If you start viewing forecasts and targets interchangeably, you run the risk of facing mounting pressure to adjust the forecast to hit the target—regardless of other factors that might be cause for a course correction—or making decisions that help assure the target is still in your crosshairs.

If you separate forecast and target, you can then have much more robust conversations about what the business is doing to make the adjustments needed to where you want to go. That gives you a much richer, more robust planning conversation than you’d have otherwise. If you keep the definitions straight in your mind, you’ll avoid this pitfall, and really get to the heart of what you’re really planning to do and the risks you’re trying to run.

Making this distinction helps unleash the power of rolling forecasts. You can emphasize that the long-term focus is on the target, but that the nimbleness of a rolling forecast helps assure you will ultimately hit that target.

Pitfall #3: Don’t throw in the kitchen sink

With forecasts, it’s often best to keep it simple. The biggest problem often is that FP&A teams include too much information, thinking that, by putting more and more detail into the forecast, they can really nail it down.

In reality, adding too much detail leads to two pervasive problems that ultimately can undermine your forecasting success. First, it requires much more work for your FP&A team and business partners. Second, handling more data and information increases the chances that your forecasts will miss the mark or be error prone.

For example, the more drivers you include, the more things you must look at, the less time you have for analysis. So if you have hundreds of drivers, you’ve got to spend hours and hours—80% or more of your time—gathering up the data, leaving precious little time to do any real analysis.”

Some experts recommend the 80-20 rule: Aim to spend 80% of your forecasting time on analysis and generating insights, and 20% on collecting data. The only way to effectively do that is to simplify and only rely on the key drivers and data points that will 

This is a guest blog post from our partner Workday Adaptive Planning, detailing three mistakes you don’t want to make with your rolling forecasts.

It’s not just meteorologists who can get forecasting wrong. If FP&A pros don’t take a thoughtful approach to establishing rolling forecasts, they can hit some unexpected stormy weather along the way. When that occurs, you run the risk of forecasts ending up, well, not being forecasts at all. They morph into updated versions of the annual budget as opposed to dynamic tools for creating visibility into the opportunities and challenges on the horizon.

Here are three pitfalls to avoid as you work to get the most strategic value out of forecasting and generate buy-in and momentum with your leadership team and business partners.

Pitfall #1: Don’t use the year-end as the stopping point

Let’s start with a driving analogy. Rolling forecasts should act like your headlights, providing steady and consistent visibility for what lies ahead. Too often, however, rolling forecasts become simply budget updates—which end up being the equivalent of driving so fast that the visibility provided by your headlights becomes increasingly limited.

The most common way organizations fall into this trap is by using the end of the year as a stopping point for forecasting. That may work in the first quarter, but by mid-year your forecast faces a hard stop in six months. And, of course, by the end of the third quarter you have a forecast that offers only three months of visibility.

When you’re forecasting with year-end being the stopping point, you’re just engaged in the process of determining if you are going to hit the year-end numbers that were established in the annual budget process.

The trouble with this approach is that it often encourages business partners to provide numbers and projections that are focused on “hitting the year-end numbers” as opposed to what is actually occurring in the business. With true rolling forecasts that don’t have an established endpoint you encourage transparency, because the focus is on assessing what is truly happening in your business and the market so you can plan and react accordingly. Not only that, but you can also generate a consistent long-range view to aid in better decision-making.

Pitfall #2: Know the difference between forecasts and targets

Forecast and targets are sometimes viewed as interchangeable. They’re not. In the simplest terms, a target is where you want to go, while the forecast continually tracks where you’re headed. In the ideal world, forecasts lead neatly toward your target. In the real world, a forecast represents the ever-changing dynamics of your business and the marketplace.

If you start viewing forecasts and targets interchangeably, you run the risk of facing mounting pressure to adjust the forecast to hit the target—regardless of other factors that might be cause for a course correction—or making decisions that help assure the target is still in your crosshairs.

If you separate forecast and target, you can then have much more robust conversations about what the business is doing to make the adjustments needed to where you want to go. That gives you a much richer, more robust planning conversation than you’d have otherwise. If you keep the definitions straight in your mind, you’ll avoid this pitfall, and really get to the heart of what you’re really planning to do and the risks you’re trying to run.

Making this distinction helps unleash the power of rolling forecasts. You can emphasize that the long-term focus is on the target, but that the nimbleness of a rolling forecast helps assure you will ultimately hit that target.

Pitfall #3: Don’t throw in the kitchen sink

With forecasts, it’s often best to keep it simple. The biggest problem often is that FP&A teams include too much information, thinking that, by putting more and more detail into the forecast, they can really nail it down.

In reality, adding too much detail leads to two pervasive problems that ultimately can undermine your forecasting success. First, it requires much more work for your FP&A team and business partners. Second, handling more data and information increases the chances that your forecasts will miss the mark or be error prone.

For example, the more drivers you include, the more things you must look at, the less time you have for analysis. So if you have hundreds of drivers, you’ve got to spend hours and hours—80% or more of your time—gathering up the data, leaving precious little time to do any real analysis.”

Some experts recommend the 80-20 rule: Aim to spend 80% of your forecasting time on analysis and generating insights, and 20% on collecting data. The only way to effectively do that is to simplify and only rely on the key drivers and data points that will provide clean and accessible forecasts.

The end result will be rolling forecasts that you can readily create and update—and that your business partners can easily understand.

This blog post was originally published on the Workday Adaptive Planning blog.

Home » Workday Adaptive Planning » Page 11

Filed Under: FP&A Done Right Tagged With: FP&A done right, FP&A skills, Rolling Forecasts, Workday Adaptive Planning

What Does Revelwood Do?

August 12, 2021 by Lisa Minneci Leave a Comment

Video

When you think of consumer companies, you might only think of them in terms of their flagship product or service. Coca-Cola sells soft drinks. McDonald’s sells hamburgers. Uber provides ride shares for people. Those companies actually do more than just what they are known for: Coca-Cola also offers Dasani, VitaminWater, Honest Kids, Gold Peak iced tea and more. McDonald’s is also known for its Filet-O-Fish and has now entered the competitive fried chicken market. In addition to offering ride shares, Uber’s services include food and goods delivery.

Many Revelwood clients think of us as their partner of choice to design and implement Office of Finance solutions based on IBM Planning Analytics and Workday Adaptive Planning. Like those consumer brands I mentioned, we do much more than that. We’ve recently added BlackLine to our best-of-breed portfolio and are looking forward to adding more world-class solutions for the Office of Finance.

We also deliver Customer Care solutions for managing and maintaining your Office of Finance systems.

Hear what our CEO, Ken Wolf, has to say about what Revelwood does and how we are enabling organizations to disrupt their companies, industries and the world.

Home » Workday Adaptive Planning » Page 11

Filed Under: News & Events, Videos Tagged With: BlackList, Customer Care, IBM Cognos TM1, IBM Planning Analytics, ken wolf, Revelwood, Workday Adaptive Planning

Planning in Workday Adaptive Planning

August 11, 2021 by Revelwood Leave a Comment

In this demonstration, we explain how to do Planning in Workday Adaptive Planning. Workday Adaptive Planning is used by companies of all sizes, across all industries, for annual budgeting, monthly forecasting, what-if scenario planning and more.

Watch this video to learn how to do common planning activities, as well as to see some of Adaptive Planning’s most popular features.

As we look at a typical expense sheet, you’ll see:

  • The importance of color coding in Adaptive Planning
  • How to do forecasting, including 3+9 forecasting
  • Different ways you can display your data
  • Shortcuts for entering data
  • Options for to using the breakback method
  • Cell-level audit trail features
  • Model Sheets
  • Cube Sheets
  • Planning directly in a dashboard
  • How to do what-if scenarios

Revelwood has many video demonstrations of Workday Adaptive Planning. Check out our Quick Takes on Workday Adaptive Planning or check back for the next expanded demonstration of Adaptive Planning.

Home » Workday Adaptive Planning » Page 11

Filed Under: Videos, Workday Adaptive Planning Insights Tagged With: Planning in Workday Adaptive Planning, Workday Adaptive Planning, Workday Adaptive Planning demo, Workday Adaptive Planning tutorial, Workday Adaptive Planning video

Workday Adaptive Planning CFO Indicator Survey 2020: The Path to Finance Digital Transformation

July 19, 2021 by Revelwood Leave a Comment

News & Events

Workday Adaptive Planning’s CFO Indicator Survey 2020: Finance Digital Transformation defines digital transformation as “the implementation and use of digital technologies such as the cloud, machine learning and augmented analytics, for finance processes to improve efficacy, insight and agility.”

The Case for Finance Transformation

What are the benefits of financial transformation? According to the report, there is a “direct link between finance digital transformation and agile business practices, swift decision-making and more efficient reporting, planning and financial close.” In other words, finance transformation makes it easier and faster to make more informed strategic decisions. It automates manual processes while reducing human error. Interestingly, the survey found that:

  • 54% of CFOs that have implemented many or some finance digital transformation initiatives consistently perform better in efficacy, confidence and agility
  • 34% of CFOs plan to prioritize finance digital transformation within one year
  • Lack of budget and proving ROI are rarely significant issues.
Graphic courtesy of Workday Adaptive Planning

Challenges for Finance Transformation

The two significant challenges CFO face when embarking a finance transformation are a technology skills gap and internal resistance to change. The report states, “It is within the CFO’s power to directly address these challenges.” The question is how?

Here are four steps CFOs can take to reduce or eliminate the technology skills gap:

  1. Determine the technology skills they need for today and for the future
  2. Understand how those new technology work and the knowledge they require
  3. Work with HR to develop a plan to acquire these skills
  4. Plan for a balance between recruitment and reskilling

Download Workday Adaptive Planning’s CFO Indicator Survey 2020 to learn more on addressing the second challenge: internal resistance to change.

Wherever you – or your CFO – are in your organization’s finance transformation, the CFO Indicator Survey 2020 has a vast amount of helpful data to inform your process.

Home » Workday Adaptive Planning » Page 11

Filed Under: News & Events Tagged With: Adaptive Insights Planning, CFO Indicator Survey, digital finance transformation, Workday Adaptive Planning, Workday Adaptive Planning Survey

Workday Adaptive Planning Tips & Tricks: Where Did My Parameters Go?

June 16, 2021 by Michelle Song Leave a Comment

Did you ever wonder where did your parameter go after you added it to a report in Workday Adaptive Planning? This post will help you find your parameters.

A parameter is helpful in matrix reports and can be used to filter your data for a specific interaction. Any report element can be added as a parameter in matrix reports. See the example below.

You can add “Timespan” as a parameter by Modified Report – Drag the Timespan element and drop it in the Parameters section. Then run the report.

Workday Adaptive Planning Tips & Tricks: Parameters

After you run the report, you will not see the Timespan parameter right away. This is because a report will only show two parameters at time. You can click on the “Change Parameters” icon and it will bring you to all parameters. The orders of the parameters in the modify report mode will define the orders of the parameters displayed in the report.

Adaptive Planning Tips & Tricks: Parameters

Workday Adaptive Planning Tips: Parameters

Incorporating parameters into your Workday Adaptive Planning reports make them more useful and user-friendly.

Visit Revelwood’s Knowledge Center for our Workday Adaptive Planning Tips & Tricks or sign up here to get our Workday Adaptive Planning Tips & Tricks delivered directly to your inbox. Not sure where to start? Our team here at Revelwood can help! Contact us info@revelwood.com for more information.

Read more Workday Adaptive Planning Tips & Tricks:

Workday Adaptive Planning Tips & Tricks: Save Personal Views on Sheets with Dashboard

Workday Adaptive Planning Tips & Tricks: Interactive Dashboards – Dynamic Planning with Embedded Sheets

Workday Adaptive Planning Tips & Tricks: Override Formulas in Sheets

Home » Workday Adaptive Planning » Page 11

Filed Under: Workday Adaptive Planning Tips & Tricks Tagged With: enterprise performance management, enterprise planning, Financial Performance Management, Workday Adaptive Planning, Workday Adaptive Planning Tips & Tricks

FP&A Done Right: Volatile Business Conditions Require Agile Planning

June 4, 2021 by Revelwood Leave a Comment

FP&A Done Right: Collaborate More When Planning

This is a guest blog post from our partner Workday Adaptive Planning, explaining how to lay the groundwork for business agility.

Manual, spreadsheet-based planning may have worked well enough in a more predictable age. But today? Not so much. Volatile conditions demand a smarter approach to financial planning and analysis (FP&A), and more and more finance professionals are discovering that legacy planning processes don’t let you go there.

It’s not that spreadsheets aren’t great—we love them. But, let’s face it, spreadsheets break down if you’re trying to rely on them systematically to gather data from across the organization, roll up departmental plans, or do complex, collaborative planning.

Even traditional market forces have proven challenging to companies relying on old-world technologies and approaches. Technological advances, ever-increasing customer expectations, and smarter, data-driven decision-making put pressure on finance teams to find new ways to operate with agility.

But how do you plan in a way that allows you to respond to such events, from the predictable to the unlikely?

The answer begins—and ends—with a modern approach to planning.

Why old-world planning is a disadvantage

The traditional planning models finance teams relied on for decades aren’t just a questionable choice in times of disruption—they can leave your business at a grave disadvantage. Businesses hampered by outdated planning processes are often left scrambling to react to changes while more agile competitors outpace, outperform, and outmaneuver them. Look around you: The companies that are performing well at this minute have pivoted—sometimes substantially—in a matter of weeks, sometimes days. Their business agility has become their defining attribute for success.

It’s safe to conclude that many of these agile businesses aren’t weighed down by manual, episodic, and siloed planning. Rather, they’ve likely embraced a more modern approach to planning—planning that’s collaborative, comprehensive, and continuous. These businesses consistently minimize risk, maximize performance, and create competitive advantages because their planning empowers greater business agility.

The difference between static and modern planning can be stark. Legacy planning tools are typically bogged down by versioning headaches and siloed, instantly perishable data. In contrast, modern, strategic planning models allow teams to broaden planning data beyond finance, pulling in real-time operational and transactional data fromERP,HCM, and other slices of the enterprise stack—all to make better, data-driven decisions quickly.

Laying the groundwork for business agility

As many companies recognized even before the current crisis, agility is a business imperative—and this more modern approach to planning is the key to achieving it. These three milestones will get you started on your journey to achieving a new way to plan.

1. Assess the status quo

Before you map out where you’re going, you need to understand where you are. Take inventory of the current state of your company, more specifically the business planning obstacles keeping you from implementing a more modern and streamlined planning environment. More than likely, these obstacles will pertain to people, processes, or technology, or some combination thereof.

Assessing where you are means getting granular.

  • What do your current business planning processes look like?
  • How long does it take you to create a budget? A forecast? An annual plan?
  • Where are opportunities for improvement?
  • Who are your planning stakeholders?
  • What technology do you have in place, and how well is it serving you?
  • What data challenges need attention?
  • What are the bottlenecks?
  • What could be automated that isn’t?
  • Are there any opportunities for automated data integration?
  • What are you lacking in workforce planning?

Answering questions like these will help you get a clear sense of what you’re working with and where you can improve.

2. Get organizational alignment

Being a change agent is no easy task. That’s why you’ll need to recruit a savvy senior-level advocate to help champion planning as a worthy and necessary cause. Along with your senior advisor, you’ll need a task force representative of other departments outside of finance, including operations, sales, and HR. Don’t forget to include IT to help you navigate technology needs and coordinate various data sources.

The next move is to align these key people with the business agility cause you’re championing.

How? Build a business case.

You can do this by quantifying the impact that the organization’s current status quo has on the company. What are manual processes and bottlenecks costing your business in time and money? What opportunities are passing you by? Conversely, what would those measurement strategies and KPI models look like if you implemented a modern, or active planning model? Try to unearth more nuanced ROI measures—for instance, how cutting budget time in half could give your people more time to run critical what-if scenarios—to really drive home the meaningful change that a modern agility planning model would bring.

Once your team is in place and your pain points recognized and quantified, you can map out a plan for your initial project. Consider focusing your initial effort on a function within finance so you’ll have control over the rollout. Develop a multi-phased plan that clearly communicates goals, a concise and actionable plan, and the key metrics for your KPI model. The ability to effectively communicate the why behind this initiative will help secure any executive buy-in you need for the how. A comprehensive and well-thought-out plan will go a long way toward achieving that.

3. Expand across the business

As noted above, there’s a strong case for beginning the rollout of your new planning model in finance and focusing on low-hanging fruit to bring early and easy wins. You’re motoring along, mapping projects, tracking and communicating progress, analyzing KPI reports, and making necessary tweaks. Once a rhythm and familiarity are in place, broaden your scope beyond finance. Initiate planning projects that engage HR, sales, or marketing. This is where you begin to extend the use and impact of modern, company-wide planning.

The key in this phase is to strengthen cross-departmental communication and collaboration. Don’t fall into the trap of relying on your technology or tools to do the heavy lifting. It will be easier to realize and maintain success with regular stakeholder one-on-ones, identifying lessons learned along the way, uncovering opportunities for more ingenuity and improvement, and communicating success and congratulations when they’re warranted.

Doing this will help elevate the role of finance to a strategic force within your organization by orchestrating planning throughout the business. Finance will no longer be known primarily for gathering budget numbers and issuing reports. Instead, your business will look to finance to drive the change and innovation needed to not only weather times of uncertainty, but to thrive in them.

These three pillars lay the groundwork for creating a more agile planning environment—one that will help you plan for what’s coming, whatever that may be. With this foundation and the insights we’ll share in subsequent blogs, you’ll be much better equipped to map your way forward into that tomorrow.

The bottom line

It’s never been easier to define the main driver of business success. It comes down to how fast your business can identify and proactively respond to change. But if your business is mired in static planning —characterized by long planning cycles, immediately obsolete plans, siloed efforts, and hard-to-find errors—it won’t be operating with maximum speed or agility.

This is doubly true in today’s fast-paced, data-driven world. Businesses hampered by outdated planning processes are often left scrambling to react to changes while more agile competitors outpace, outperform, and outmaneuver them.

Wherever you are on your planning maturity journey, the tasks here will help you expand and accelerate business agility by:

  • Creating a new kind of planning mechanism that’s distributed, inclusive, and optimized for your strategic objectives.
  • Empowering finance to continuously deliver insights that help the business course-correct. To power better, faster decision-making in ever-shorter cycles based on rolling forecasts and real-time (and eventually, predictive) data.

The truth is, building a continuous one-to-one alignment between your strategic vision and your operational reality isn’t easy. It’s something very few businesses can claim. You won’t get there overnight and you will face hurdles.

But it only takes a few small steps in the right direction before momentum starts to build. Before long, those steps will amount to a giant leap forward and significant competitive advantage as business agility accelerates exponentially.

This blog post was originally published on the Workday Adaptive Planning blog.

Home » Workday Adaptive Planning » Page 11

Filed Under: FP&A Done Right Tagged With: agile planning, business agility, FP&A, FP&A done right, modern FP&A, Rolling Forecasts, Workday Adaptive Planning

FP&A Done Right: Accurate Forecasting = Insightful Decisions

May 21, 2021 by Revelwood Leave a Comment

This is a guest blog post from our partner Workday Adaptive Planning, explaining how great financial forecasts can guide business strategy.

If 2020 taught CFOs anything, it’s that they need well-executed financial forecasts and models from their FP&A team. Accurate forecasts help finance leaders make insightful, data-driven decisions, allowing their organizations to prepare for market conditions and trends, adapt to revenue and expense fluctuations, and execute strategic action plans.

So, if you’re interested in creating more accurate and reliable forecasts that can warn finance leaders when they need to make major changes, read on. You’ll learn how to create the kind of financial forecasts that guide business strategy.

Build an accurate business model

Before you can build a comprehensive financial forecast, you need to construct a well-designed business model. One way to do that is by modeling revenue. An effective revenue model should be able to answer questions like, “Which investments and actions are necessary to grow revenue by 25% next year?” Or, “If revenue remains flat, which programs should we cut to maintain profitability?” With the right model in place, you’ll have the flexibility to run scenarios and examine assumptions so you can answer these questions with confidence.

The purpose of revenue models is to forecast the sales volume and mix of products and standard service line offerings. They will vary widely based on your industry and business model. For example, a manufacturer might consider variables like capacity and utilization, while a law firm might look at client lists and billing rates. Whatever the nature of your business, the right model will help you get a better handle on revenue so you can drive your business forward.

Consider the money going out

In addition to the dollars coming in, your financial forecast will need to consider the money going out—expenses. Consider these key factors when modeling your expenses.

  • Personnel. This is likely your largest expense. If your organization is primarily salaried employees, you might forecast personnel expenses on a per-employee basis. If, however, you are a national retailer or restaurant chain with a large number of hourly employees, you may prefer to build a forecast based on work shifts or job roles.
  • Operating expenses. These are often tightly correlated with headcount. Your expense model should reflect that.
  • Cost of goods sold. You will need to forecast all costs associated with the delivery of revenue—including labor, materials, and overhead.
  • Fixed versus variable costs. Understanding what drives an expense is critical to getting the modeling right. A fixed cost (such as a data center) should be modeled in a way that it is not impacted by changes in revenue volume, while a variable cost (such as raw materials and packaging) might be modeled according to a formula (e.g., as a percentage of total revenue).
  • Overhead cost allocations. In some cases, you’ll want to trace and assign costs across segments or cost centers and possibly further to products, standard service lines, and ultimately to customers. Distributing IT expenses across multiple departments, for example, may help you understand the “fully loaded cost” of IT’s services to its various internal users. Begin by identifying “drivers” as the basis of your expense distribution. For instance, some overhead costs might be based on the number of customer orders or, for manufacturers, based on the number of material moves or machine setups. “Drivers” reflect the consumption view for how outputs consume expenses with a cause-and-effect relationship. (Activity-based costing is often used for this calculation.)

Get rolling with rolling forecasts

Once you’ve built your revenue and cost model, it’s important to define a frequency interval cadence and a calendar to recalculate the model. Financial forecasting is not a one-off exercise, but rather a practice to develop and refine over time.

By implementing a rolling financial forecast approach, you can revisit and update customer demand forecasts continuously based on actual data and performance to allow on-the-go course-correction as conditions and context change. Continuous forecasting helps you answer critical questions such as, “How are we doing against our plan?” and, “How should we adapt our plans and actions going forward?”

While some reforecasts may occur on an ad hoc basis, you should establish a consistent frequency cadence, whether semiannually, quarterly, or monthly. Each reforecast is an opportunity to assess performance and revise assumptions about the future. Your reforecasts can live alongside your original plan (and in some cases your annual fiscal budget) and represent your latest and best predictions of business performance and planned outcomes.

In some cases, you may need to generate forecasts on a much more frequent basis. Retail, hospitality, and other highly seasonal businesses may engage in daily or weekly monitoring to reflect customer shopping patterns. Other businesses may choose to do a flash weekly forecast around the product or service offering sales volume and mix or on other operational key performance indicators (KPIs) to ensure they remain on track.

Define your reporting process

Once you construct a comprehensive model of your business and incorporate your insights and assumptions into your financial forecasting process, you need to define a set of reports to be used (both internally and externally). Your reports should provide an easy-to-understand view of company health. They should include more than just a financial income statement and balance sheet view plus a pro forma net cash flow of your company’s finances. They should incorporate the monitoring of performance of both strategic KPIs and operational process-based performance indicators that you can easily share with your board of directors and management teams.

An efficient reporting process isn’t just about the reports you generate. It’s also about how you get there.

If you manage reports using only spreadsheets, then you’re familiar with the process of bringing together all your data sources, manually importing them into various spreadsheets, and emailing them around for approval. And that doesn’t even include the ad hoc requests you receive by email or from people passing you in the hallway.

The key to getting everyone the reports they need, faster and more accurately, is automation. An automated platform simplifies the gathering, reconciliation, extraction, and validation of your data. That alone can transform your reporting processes from a monthly hassle to a dynamic, ongoing influencer of organizational change.

Drive collaboration

So, you’ve automated your reporting. You’ve established a regular frequency cadence. And you’ve amazed your stakeholders with the insights you’ve shared. But if you’re still the gatekeeper of information, you may be missing out on a tremendous opportunity. When stakeholders are not directly involved in the planning process, they don’t feel a sense of ownership.

When data is accessible through self-service financial forecasting tools, people will be more likely to adopt a proactive approach to gathering critical finance data, and they’ll come to embrace your plan as their own.

Choose the right modern planning software

To help you take these steps, you’ll need the right financial forecasting tools. While Excel is where most finance teams get started, it’s not built for scale. As organizations grow and data sources multiply, organizations must turn to a cloud finance solution that can:

  • Facilitate collaboration. Get everyone in your organization involved in the planning process by giving them access to real-time data so business partners can take ownership of the numbers that they will likely be held accountable for.
  • Enable multiple what-if scenario planning. Combine high-level, top-down growth- and profit margin-based models with detailed, bottom-up personnel rosters and schedules in a single platform so you can quickly reconcile differences and address gaps.
  • Provide a single source of truth. With a core set of operational and financial data that’s common across the company, you can align the organization with the executive team’s strategy and monitor the organization’s performance in executing the strategy.
  • Automate reporting. With centralized reporting and automated data integration, you can eliminate the need to hunt for and manually aggregate data. That frees up more time to focus on analysis while providing stakeholders with the information they need to make better, faster decisions.

Financial forecasting comes down to answering a few key questions: How well can you understand your company’s position in the context of the economic environment? How much insight can you display into what’s driving opportunity and risk and causing problems? And perhaps most important of all, how ably can you communicate these insights to decision-makers throughout your organization? With the right financial forecasting tools, you can have all those answers right at your fingertips—and you can help every team member feel part of the process.

This blog post was originally published on the Workday Adaptive Planning blog.

Home » Workday Adaptive Planning » Page 11

Filed Under: FP&A Done Right Tagged With: accurate forecasting, enterprise performance management, enterprise planning, financial forecasting, Financial Performance Management, great financial forecasts, Rolling Forecasts, Workday Adaptive Planning

FP&A Done Right: 3 Steps for Selecting your KPIs

May 7, 2021 by Revelwood Leave a Comment

FP&A Done Right: Collaborate More When Planning

This is a guest blog post from our partner Workday Adaptive Planning, explaining how to identify the most appropriate KPIs for your organization.

Now more than ever, companies that are unable to adapt or pivot easily to adjust to changing market conditions don’t just risk falling behind. They risk their very future.

But business agility isn’t something you can implement overnight. It takes a modern, multifaceted planning environment—one that isn’t weighed down by static, legacy planning processes characterized by spreadsheets, siloed data, outdated annual plans, and stale historical snapshots.

Today, forward-thinking CFOs and their FP&A teams understand the need for nimble, data-driven financial modeling powered by cross-departmental collaboration and encompassing a panoramic view of the business—one where planning happened not just within finance but throughout the enterprise. This is the definition of modern approach to planning.

And it’s exactly what businesses need right now.

In a recent blog, we outlined the three key steps that help you lay the groundwork for a modern planning model within your own organization. To realize the full potential of that groundwork, you’ll also want to engage a series of key initiatives that will amplify your ROI and increase the velocity of business transformation. Here we look at the first of these: identifying your critical KPIs.

When everything is important, nothing is important

When everything is deemed critical, how can you be expected to prioritize? It’s impossible to effectively plan or make decisions quickly when it’s unclear what is truly driving business success. Bring those mission-critical KPIs to light, however, and you can quickly get everyone aligned around them.

But before homing in on these metrics, it’s imperative to step back, take a look at the entire organization, and recognize that performance is tracked differently in each department and team. Your core KPI model should take into account different flavors of measurement strategy across departments, recognizing the metrics that weave through multiple departments. This will help ensure that planning is collaborative and comprehensive, and that tracking progress and reporting means the same thing to all the players involved. The biggest plus in all of this? This shared measurement strategy establishes company-wide ownership and direction.

To help you isolate your organization’s KPIs (and ultimately to plan better), consider these three steps.

1. Partner with operational leaders to uncover their mission-critical KPIs.

Rather than try to guess what functional leaders care about, take the time to sit down with those key stakeholders and walk through how they define success. What does their measurement strategy look like? How do they currently track and manage their own progress? What are their data sources? Whom are their reports important to? Do they use specific language or terminology that might mean different things to people in other departments? Be as thorough as possible in fleshing out their measurement strategy and any processes they have in place to support it.

2. Keep it simple.

People can get caught up in attempting to adhere to KPIs that aren’t easily tracked or aren’t even truly indicative of performance. Avoid establishing complicated processes or adding new, hyper-focused metrics to the mix. Yes, your goal is to maintain accuracy, but you need to balance it with minimum resistance. The last thing you want is to get lost in data and complicated algorithms, forcing you in the end to have to manually follow up with gatekeepers when the time comes to pull a report.

3. Establish a reporting system.

After isolating the necessary KPIs, you’ll need to set up some workflows around reporting. What are the tools you need to access and generate a KPI report? Are these tools accessible and easy to use for all stakeholders? What are the bottlenecks, and who are the gatekeepers holding back the flow of KPI reports? Ensure your reporting operations are accessible, easy to use, and accurate enough to give you a true snapshot of your organization’s progress—without data overload.

This blog post was originally published on the Workday Adaptive Planning blog.

Home » Workday Adaptive Planning » Page 11

Filed Under: FP&A Done Right Tagged With: enterprise performance management, Financial Performance Management, FP&A done right, KPIs, Office of Finance, Workday Adaptive Planning

FP&A Done Right: 5 Ways Dashboards Empower The Office of Finance

April 23, 2021 by Revelwood Leave a Comment

This is a guest blog post from our partner Workday Adaptive Planning, exploring how to unlock hidden opportunities with dashboards & analytics.

Visualizing data is often the fastest way to identify trends and patterns that lead to insights and better decision making. That’s because the simple clarity of visualizing data via interactive dashboards can reveal hidden opportunities that likely would have been missed in more traditional analysis and sharing of data.

Here are five ways dashboards can help identify valuable insights that may have been overlooked in the past.

1. Dashboards encourage company-wide planning (or xP&A)

Simply making dashboards accessible to stakeholders throughout the organization represents a huge win in itself—and a significant step toward breaking down silos. Yet beyond that, increasing the number of people who have access to data presented in digestible formats exponentially increases the chances of those aha moments occurring. The production floor manager will surely have a different perspective than the CFO. When that perspective is informed with accessible data delivered via a dashboard, the stage is set for new efficiencies and improved productivity.

2. Dashboards show instead of tell

There’s a reason the phrases “go through the numbers” and “eyes glaze over” are often uttered in the same sentence. Traditionally, delivering financial information has largely been a one-way conversation with the finance team presenting mundane reports and data downloads. With the exception of the number crunchers in finance and accounting, many business partners get lost or disinterested when presented with a number or data overload. Dashboards avoid this challenge by elevating the data to the next level and using graphics and visualizations to clearly show data in formats that provide key context and clarity. When data gets presented in highly visual and familiar formats, business users can often quickly see challenges and opportunities that otherwise might have been missed.

3. Dashboards offer customized views for different thinkers

Different people consume information in a wide range of ways. Some may be more comfortable viewing data presented in standard bar, column, gauge, area, and doughnut charts. Yet others benefit from data presented in more engaging or interactive formats. Workday Adaptive Planning dashboards feature data visualization that includes funnels, dials, waterfalls, bubbles, histograms, radars, and Pareto charts. Users across locations and on any device can view data in the formats that connect with their unique way of learning and thinking.

4. Dashboards are ever-present

Even finance pros and business leaders who are adept at extracting insights from traditional reporting face the challenge of locating reports once they are filed away. And once people find the report, they have the time-consuming process of checking if the data is still accurate. Conversely, dashboards are continuously available via a wide range of devices with data updated in real time, assuring users that they are working with the latest available information. So if conditions change or a new opportunity arises, easy-to-access data visualization is there to support decision-making and reveal how an opportunity may be quickly leveraged.

5. Dashboards are inviting and simple to use

The simple power of dashboards is that they are easy to use and invite users to experiment, explore, and discover. By eliminating the complexity barrier, the odds of uncovering hidden opportunities expand dramatically. Ultimately, dashboards create the opportunity for self-service analysis for everyone. That allows any user to perform drilldown analytics, create period-to-period comparisons, and explore iterative what-if analyses that can effectively identify issues that need immediate attention while also identifying trends that could be leveraged through sales and targeted marketing efforts.

This blog post was originally published on the Workday Adaptive Planning blog.

Home » Workday Adaptive Planning » Page 11

Filed Under: FP&A Done Right Tagged With: Adaptive Insights, Adaptive Planning, dashboards, FP&A, FP&A done right, Workday Adaptive Planning, xP&A

  • « Go to Previous Page
  • Page 1
  • Interim pages omitted …
  • Page 9
  • Page 10
  • Page 11
  • Page 12
  • Page 13
  • Go to Next Page »

Footer

Revelwood Overview

Revelwood helps finance organizations close, consolidate, plan, monitor and analyze business performance. As experts in solutions for the Office of Finance, we partner with best-in-breed software companies by applying best practices guidance and our pre-configured applications to help businesses achieve their full potential.

EXPERTISE

  • Workday Adaptive Planning
  • IBM Planning Analytics
  • BlackLine

ABOUT

  • Who We Are
  • What We Do
  • How We Help
  • How We Think
  • Privacy

CONNECT

World Headquarters

Florham Park, NJ | 201 984 3030

European Headquarters

London & Edinburgh | +44 (0)131 240 3866

Latin America Office

Miami, FL | 201 987 4198

Email
info@revelwood.com

Copyright © 2025 · Revelwood Inc. All rights reserved. Revelwood® and the Revelwood logo are registered marks of Revelwood Inc.