One of the new features in Excel is the ability to create Map Charts to compare values and show categories across geographical regions.
If you have your own set of data to use skip to step 3. Otherwise, we can accomplish this in a few easy steps using one of Excel’s preset geographical data types:
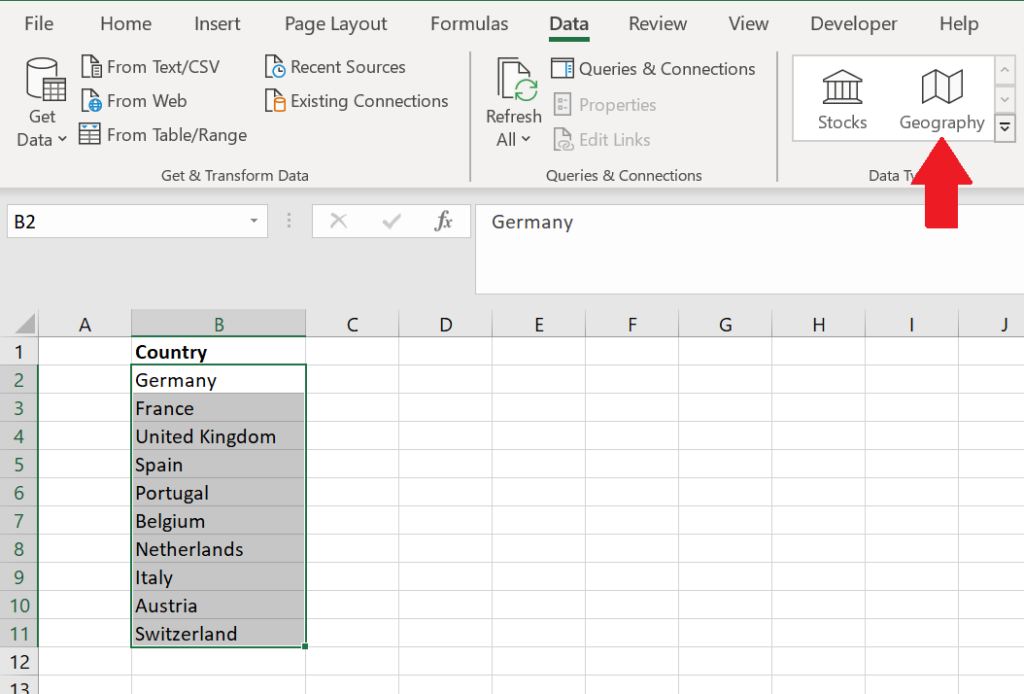
- Once you have your list of geographical values, navigate to the Data Tab > Data Types > Geography.
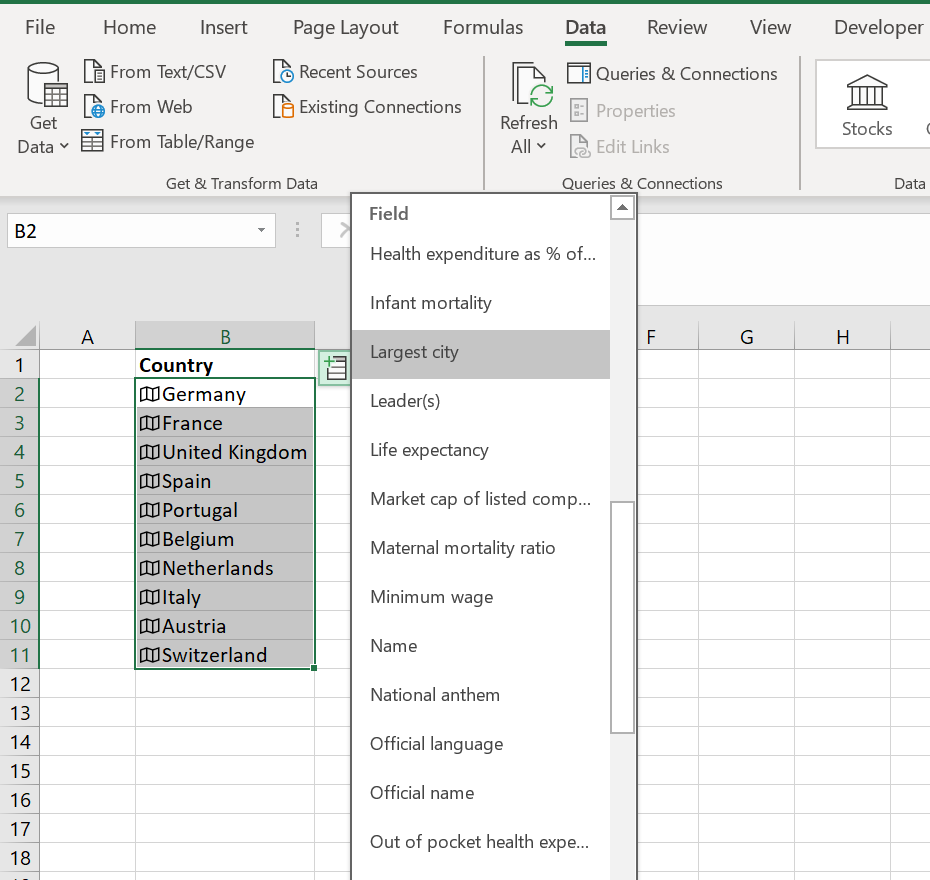
- An option to insert data will appear. This will offer several preset options that will be automatically populated once selected.
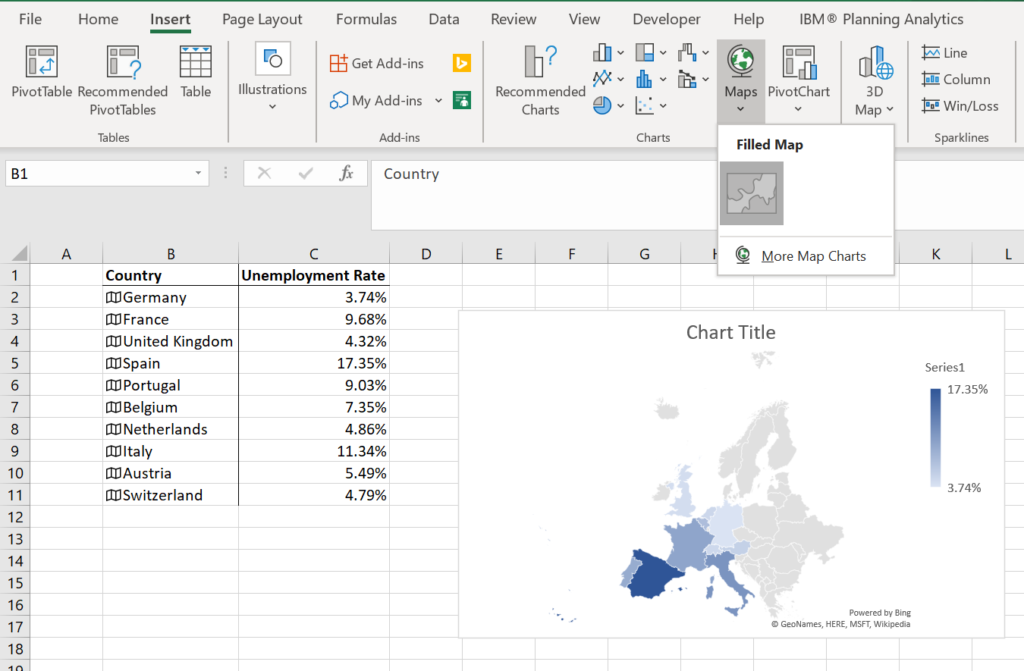
- Now that data is populated the Map Chart can be created. Highlight your table, navigate to the Insert Tab > Charts > Maps > Filled Map. A Map Chart will now be created
This is a nifty feature in Excel that will help visualize your data. Remember, this feature is already built-in to Planning Analytics Workspace! Learn more about this in our earlier blog post on displaying data in maps.
IBM Planning Analytics, which TM1 is the engine for, is full of new features and functionality. Not sure where to start? Our team here at Revelwood can help. Contact us for more information at info@revelwood.com. And stay tuned for more Planning Analytics Tips & Tricks weekly in our Knowledge Center and in upcoming newsletters!
Read more IBM Planning Analytics Tips & Tricks:
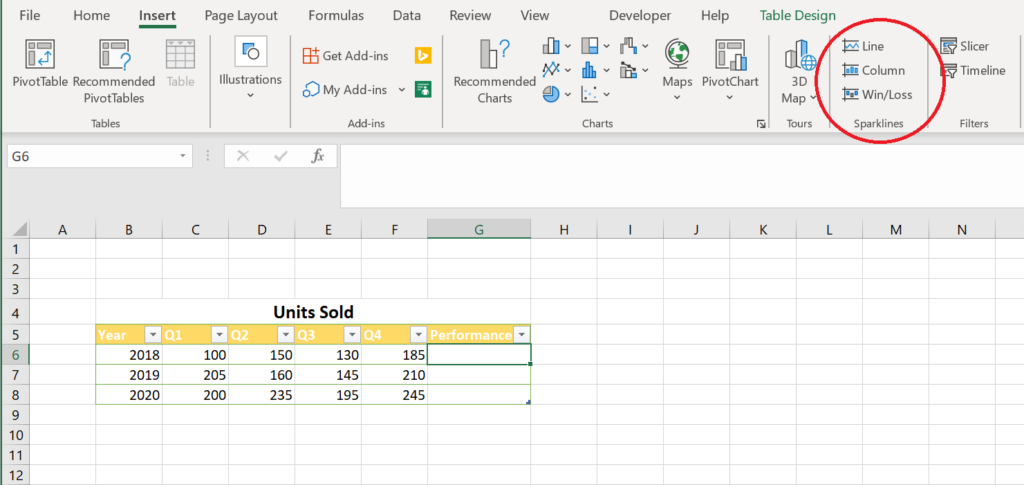
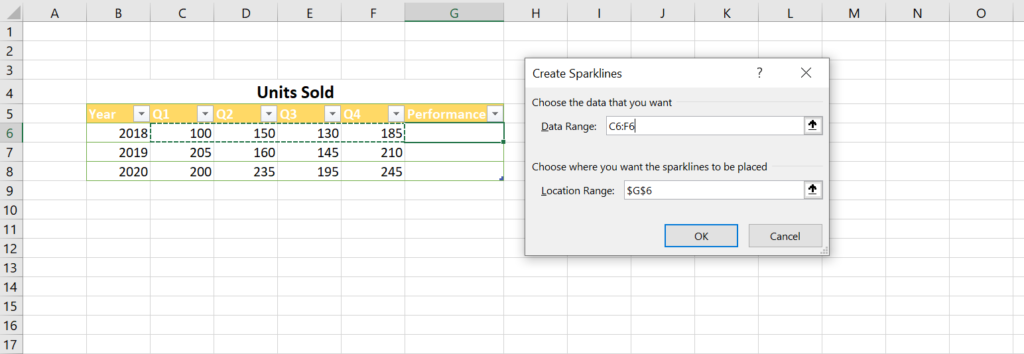
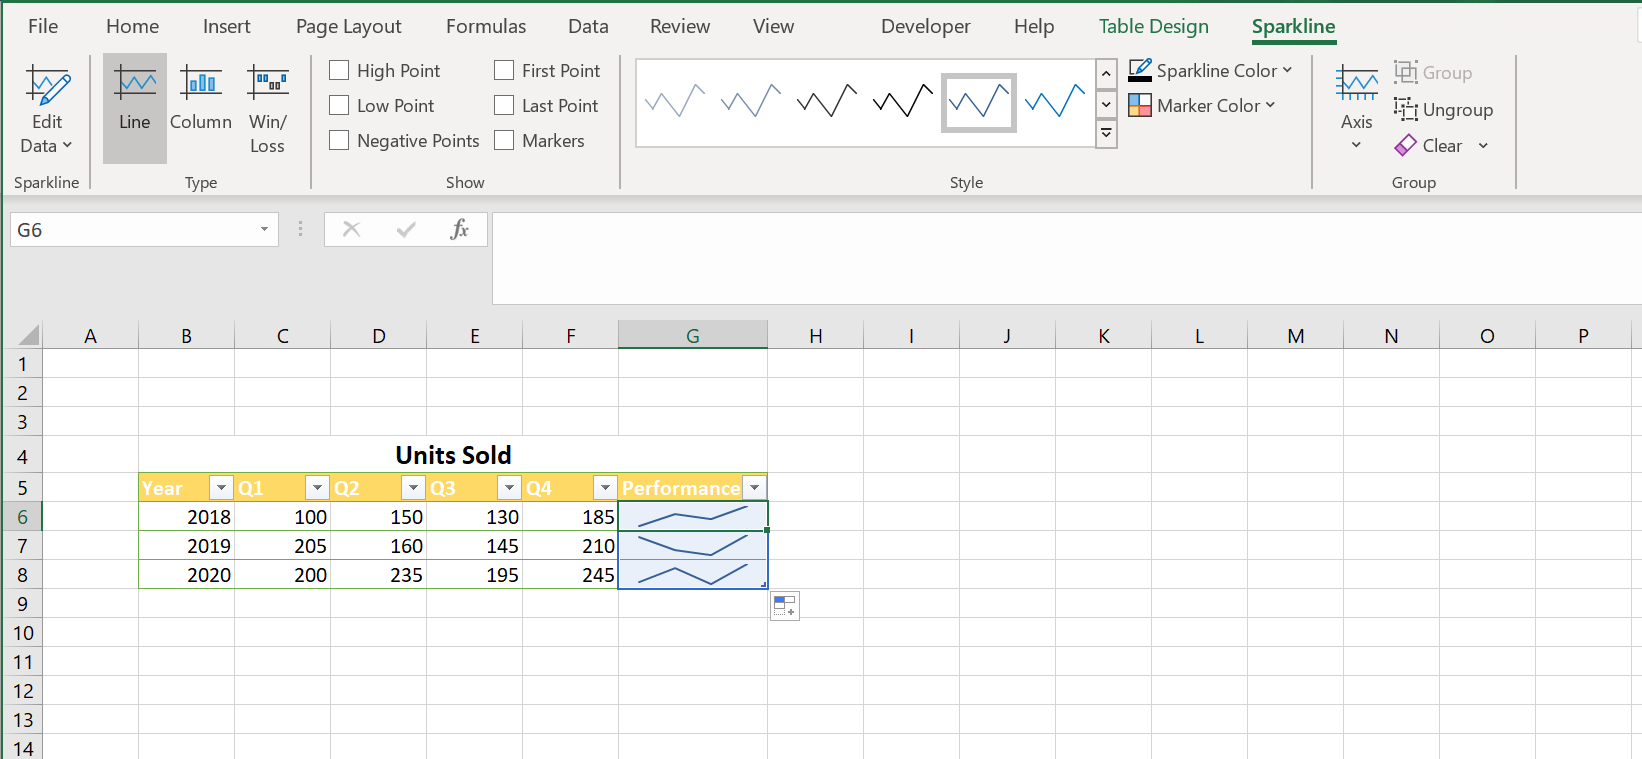
IBM Planning Analytics Tips & Tricks: Sparklines
IBM Planning Analytics Tips & Tricks: Visualizing Data in Pie Charts
IBM Planning Analytics Tips & Tricks: Creating a Simple Dashboard in Planning Analytics Workspace