A while back I wrote a blog about the SCAN function which showed how you can search for specific characters and then combine this with the SUBST formula to create new sets of text. But what if you wanted an easier way to simply skip some characters within the string? This can be done with the DELET function.
The DELET function is used to delete a set of characters from within a string. The syntax of the command is:
DELET (string, start, number)
- String = the source text string
- Start = the character where deletion will begin
- Number = the number of characters to delete
For example:
DELETE (‘phone’, 2, 3) returns ‘pe’
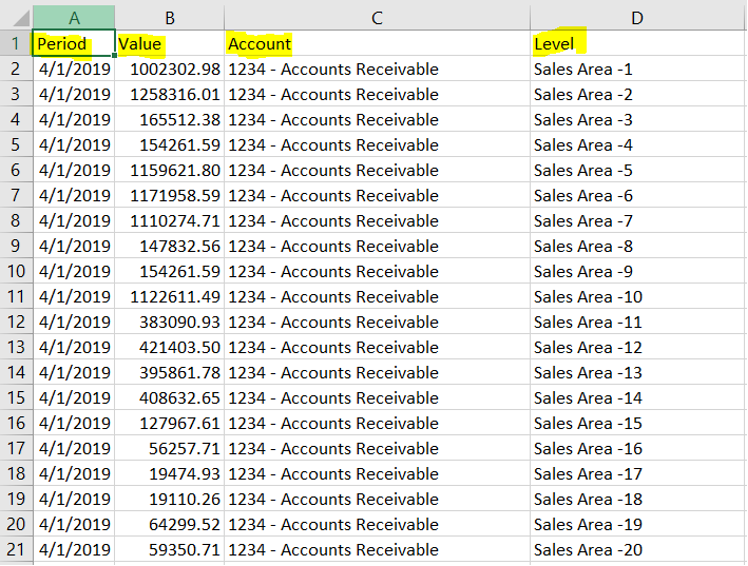
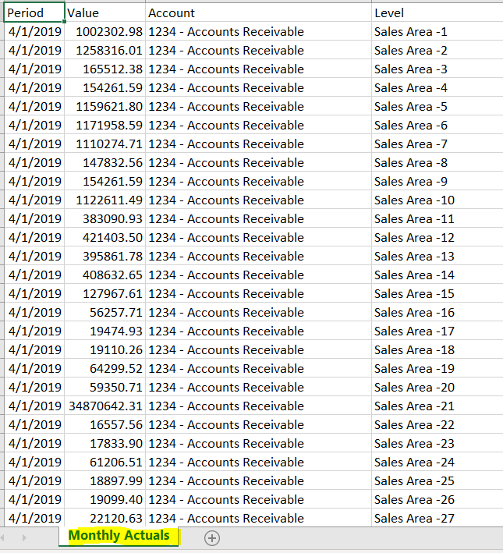
This function can be used to perform tasks such as removing dashes in between an element code number and name or removing a prefix from a list of elements. This will simplify your code by allowing you to simply ignore some text instead of merging two substrings together.
Revelwood has worked with IBM Planning Analytics / TM1 for more than 27 years. We’ve partnered with hundreds of companies on the design, development, maintenance and updates of IBM Planning Analytics applications, across every industry. Have a challenge with Planning Analytics / TM1? We can help you!
Read More IBM Planning Analytics Tips & Tricks:
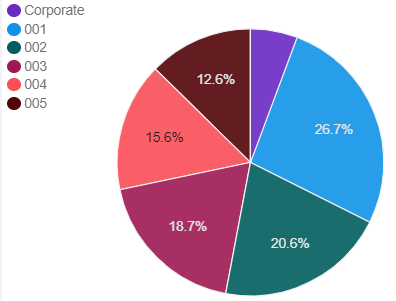
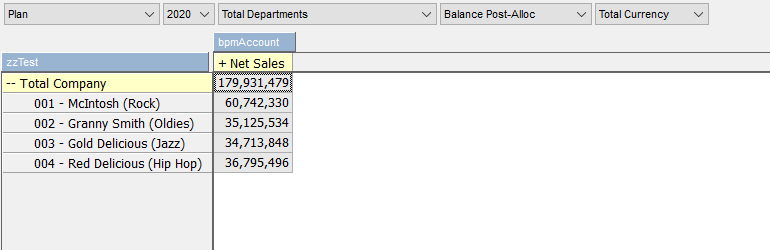
IBM Planning Analytics Tips & Tricks: Using Charts and Data Series with Dynamic Reports
IBM Planning Analytics Tips & Tricks: Stacked Rows in PAx
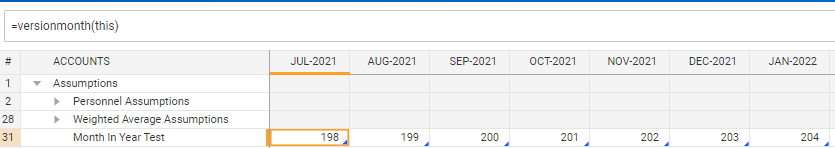
IBM Planning Analytics Tips & Tricks: PASS Version Numbering