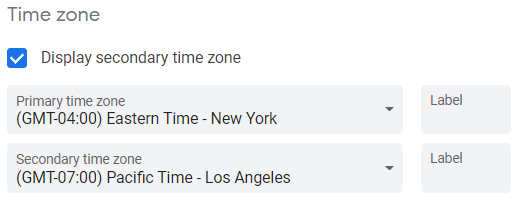
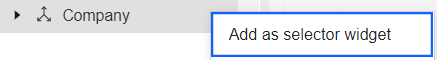
IBM Planning Analytics Workspace (PAW) allows you to easily create selector widgets that can be used for updating the data in your PAW book. This is done by adding a dimension as a selector widget.
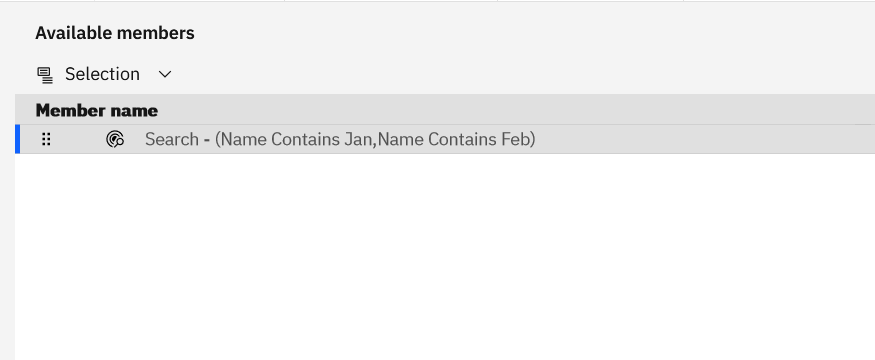
You can edit the list of elements (e.g., the set) and the way the list appears. The selector widget allows you to easily select an element that is synchronized to your charts and explorations. When selecting the element, a border appears around the widget.
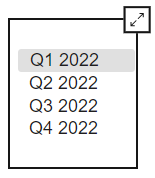
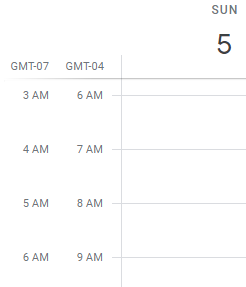
While this border offers features such as the ability to expand the screen, it clearly makes the list into a separate section of the page. You can remove the border by using the property called “Show selected border in preview” (within the area called General, Appearance). Here is the same list without the border enabled:

This property will allow you to create the perception of a single page and not a set of independent objects.
Revelwood has worked with IBM Planning Analytics / TM1 for more than 27 years. We’ve partnered with hundreds of companies on the design, development, maintenance and updates of IBM Planning Analytics applications, across every industry. Have a challenge with Planning Analytics / TM1? We can help you!
Read more IBM Planning Analytics Tips & Tricks:
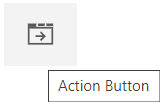
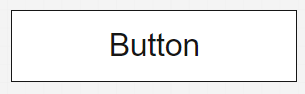
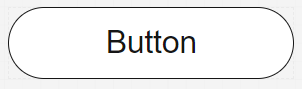
IBM Planning Analytics Tips &Tricks: Rounded Buttons in Planning Analytics Workspace
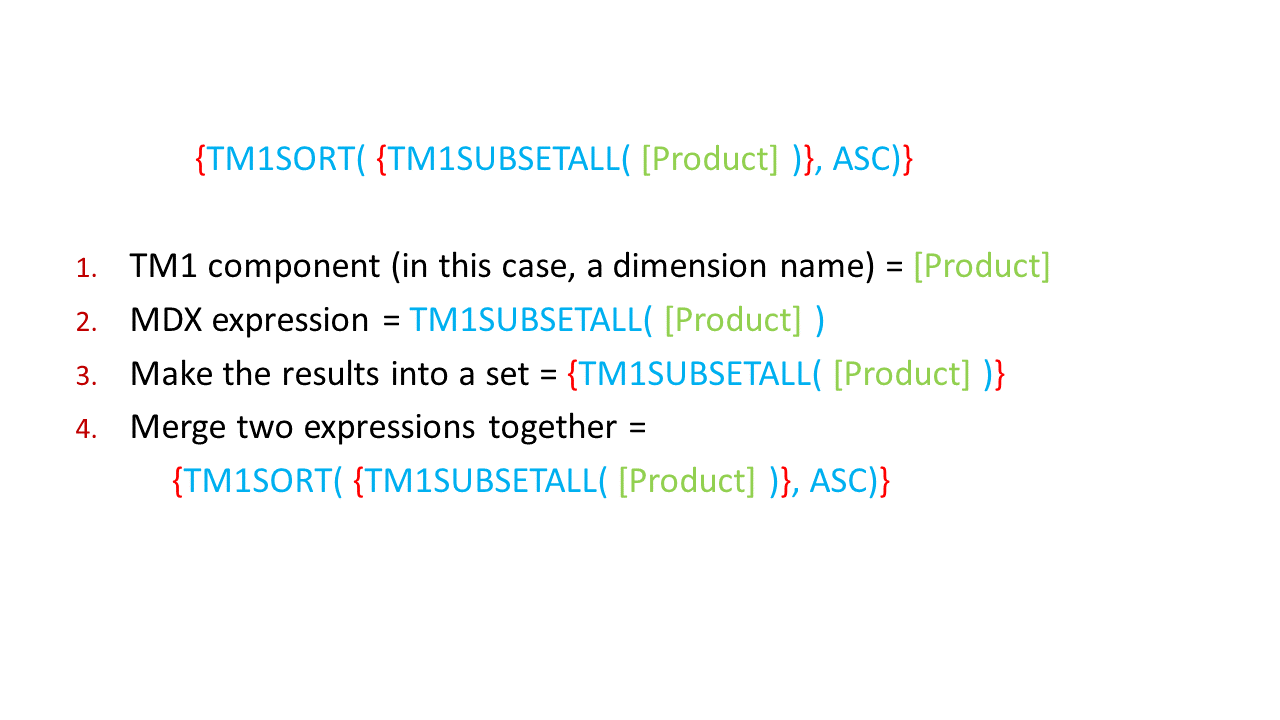
IBM Planning Analytics Tips & Tricks: MDX Syntax Explained
IBM Planning Analytics Tips & Tricks: Global Settings in Overview Area of Exploration