Do you regularly work with others that are in a different time zone? If so, how often have you heard your counterpart tell you to “just determine my time by adding X hours to yours.” And how often have you messed up that simple math by subtracting X or by adding Y?
If you use Google calendars, then you don’t have to do this math each time you attempt to schedule a meeting. Google’s calendar allows you to show two time zones in your sidebar.
To enable this setting, click on the settings icon and select the option for Time Zone. From there, enable the option to “Display secondary time zone” and then select the time zone.
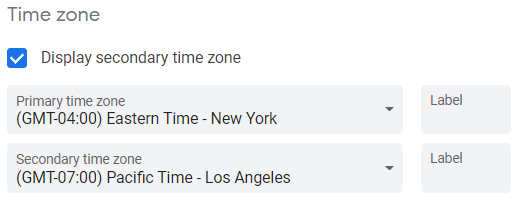
Once defined, you will see two time zones on the left side of your calendar.

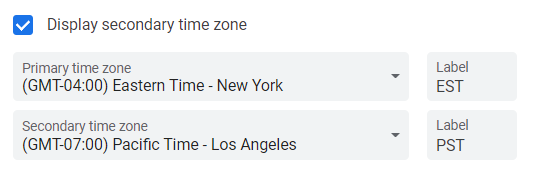
And Google also allows you to expand this further. If you don’t remember what time zone correlates with each GMT setting, you can also customize each header label.
This approach will help you quickly define time zones for your coworkers while also avoiding their jokes about your basic math skills!
Revelwood has worked with IBM Planning Analytics / TM1 for more than 27 years. We’ve partnered with hundreds of companies on the design, development, maintenance and updates of IBM Planning Analytics applications, across every industry. Have a challenge with Planning Analytics / TM1? We can help you!
Read more IBM Planning Analytics Tips & Tricks:
IBM Planning Analytics Tips & Tricks: PAW Visualization Value Labels
IBM Planning Analytics Tips & Tricks: Correctly Sum Rounded Numbers in Excel
IBM Planning Analytics Tips & Tricks: Planning Analytics Workspace Process Editor Function Help