Do you know how to see attributes and attribute types in IBM Planning Analytics Workspace (PAW)?
While in the dimension editor, click on the tab that says Attributes.

The attributes will be presented to the right of the elements. But how do you know what type of attribute it is?
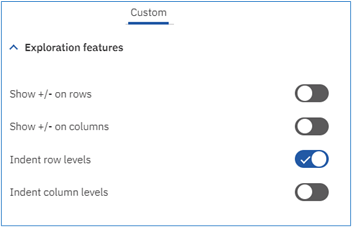
To see the attribute type click on the “gear” icon. A context menu will present itself that allows you to click an option called “Attribute Type.”

Once enabled, you will now see icons that tell you what type of attribute it is:

- 123 means the attribute is numeric
- abc means the attribute is text
- The “person” icon means the attribute is an alias
This approach will help you easily define types when populating and using attributes.
Revelwood is an IBM Gold Business Partner with 25+ years of experience designing, developing, implementing and maintaining IBM Planning Analytics environments. Revelwood has helped clients in all sizes across all industries optimize and grow their use of Planning Analytics. Revelwood’s Planning Analytics team consists of experienced PA experts, including a multi-year IBM Champion.
Stay up to date with PA – sign up for our weekly Planning Analytics Tips & Tricks newsletter, subscribe to our YouTube channel, and join our IBM Planning Analytics All-Stars group on LinkedIn.
Read more IBM Planning Analytics Tips & Tricks:
IBM Planning Analytics Tips & Tricks: Search with Descendants
IBM Planning Analytics Tips & Tricks: PAW – Navigation Approaches Using Action Buttons
IBM Planning Analytics Workspace Settings: DIM Editor Page Size