Are you new to IBM Planning Analytics and looking for a good way to learn about the various commands associated with MDX? The Planning Analytics subset editor offers a great way to teach you about MDX expressions that can be used to define elements within a dimension.
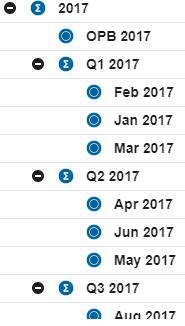
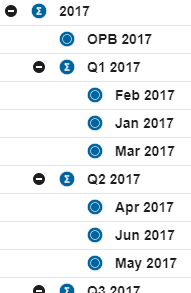
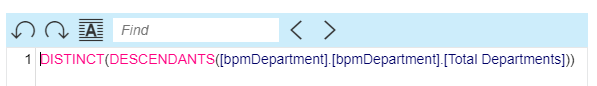
The example below shows the results of a subset that includes all descendants of Total Department. The subset was created by simply dragging Total Departments into the current set while having the member insertion defined as descendants.
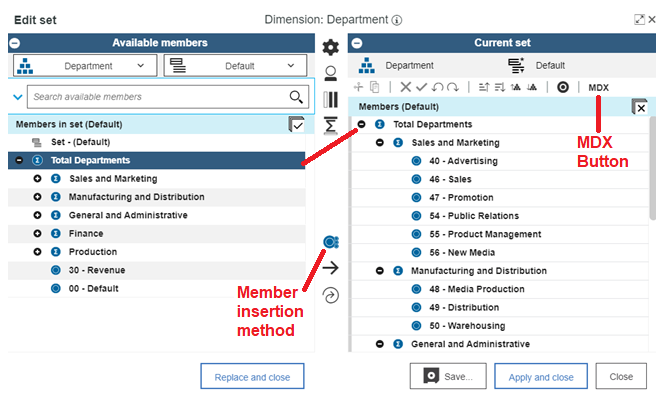
Once created, I can see the MDX expression that is used by clicking the MDX button at the top, right corner of the screen. The resulting expression is:
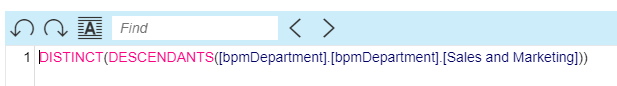
However, this button is not only used to view your newly created MDX expressions. The button also allows you to edit the expression. In this case, I can change the root element to be Sales and Marketing by simply typing over the existing MDX expression.
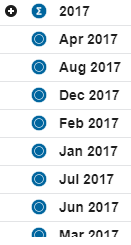
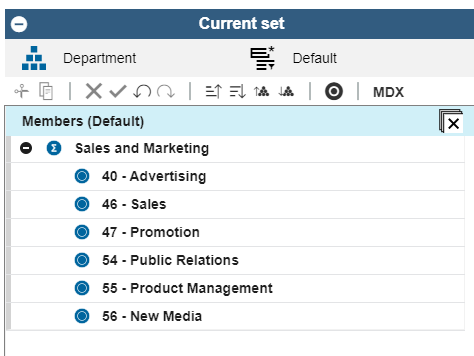
After clicking the OK button, the elements in the current set are updated.
This approach can help you to learn the fundamentals of MDX expressions, which are helpful for many different components of Planning Analytics.
IBM Planning Analytics, which TM1 is the engine for, is full of new features and functionality. Not sure where to start? Our team here at Revelwood can help. Contact us for more information at info@revelwood.com. And stay tuned for more Planning Analytics Tips & Tricks weekly in our Knowledge Center and in upcoming newsletters!
Read more IBM Planning Analytics Tips & Tricks:
IBM Planning Analytics Tips & Tricks: Sort Elements Within a Subset
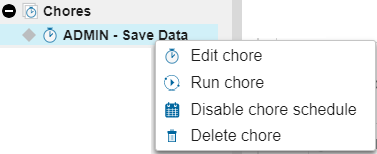
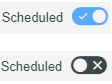
IBM Planning Analytics Tips & Tricks: Editing Chores While Active
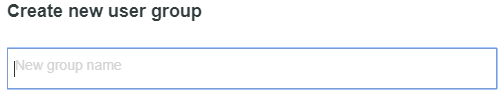
IBM Planning Analytics Tips & Tricks: Creating Groups in PAW