Have you ever been deep in thought while writing a rule or a process only to realize that you forgot the parameters for a specific command? IBM Planning Analytics Workspace (PAW) has solved this dilemma by giving you the ability to determine those parameters with a simple set of keystrokes.
PAW’s rule editor and process editor allows you to use Ctrl-Space (e.g., press the control key and the space bar at the same time) to determine the required values associated with any rule or TI command. For example, if I type ATTRS and then press Ctrl-Space, the following will appear on the screen:
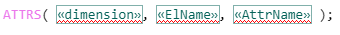
I now know the parameters that are required to complete the code.
Ctrl-Space will also help you determine which function to use. For example, if I type ATTR and then press Ctrl-Space, the following will appear on the screen:
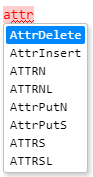
I am now aware of all the possible attribute functions that are available and can double click on one of the results to have it automatically inserted for me.
If I do not know anything about the name of the functions to use, I can click on the fx button to see a list of the available functions, all grouped by category.
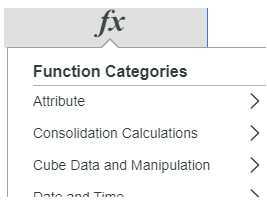
This approach allows you to quickly remember the functions and parameters that can be used in your code without having to shift your focus to another screen or manual.
IBM Planning Analytics, which TM1 is the engine for, is full of new features and functionality. Not sure where to start? Our team here at Revelwood can help. Contact us for more information at info@revelwood.com. And stay tuned for more Planning Analytics Tips & Tricks weekly in our Knowledge Center and in upcoming newsletters!
Read more IBM Planning Analytics Tips & Tricks:
IBM Planning Analytics Tips & Tricks: Home Button
IBM Planning Analytics Tips & Tricks: Subset Control Dimension