Do you know about cohort modeling in Workday Adaptive Planning?
A cohort model provides meaningful insight of data grouped into subsets based on any characteristic important to the company. The groups are called “cohorts.” Cohorts can be based on time (i.e. season, monthly, yearly), segment (i.e. commercial, residential), or size (i.e. low, medium, high), just to name a few. Cohorts follow a pattern of behavior that helps analysts project future trends. This can help companies focus efforts on lowering churn and optimizing revenue.
Cohort model vs. Regular model
Compared to a regular model, a cohort model provides a more granular view of the data. Projecting revenue at the cohort level helps companies understand outliers that would otherwise be missed in a regular revenue model.
For example, in a regular model, projected revenue shows overall revenue for the year and may show growth. However, if you dig further into the segments, you will see that one cohort, such as small businesses in the manufacturing industry, had a large decline in sales.
If this information was available early in the year, further decline could have been prevented and management could have strategized to avoid a blow to the bottom line in the following year. Maintaining and analyzing multiple cohort models on a regular basis is crucial for successful strategic planning.
Where to use cohort modeling
- Subscription base revenue – tech, gaming, food, streaming, service, etc.
- Contract billing – by milestone, period, ASC 606 amortization, etc
- Seasonality base revenue
- Freemium – lead conversion
- Sales Rep capacity or conversion
How to build cohort models in Workday Adaptive Planning
Cohort model in Adaptive may comprise of multiple sheets. Below is an example of a cohort model structure.
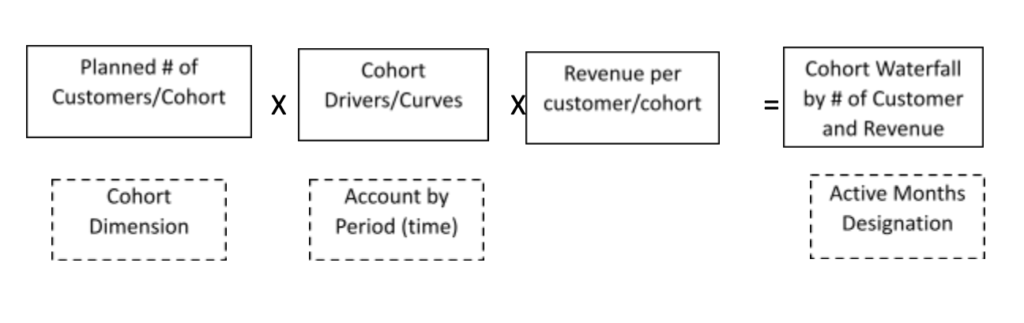
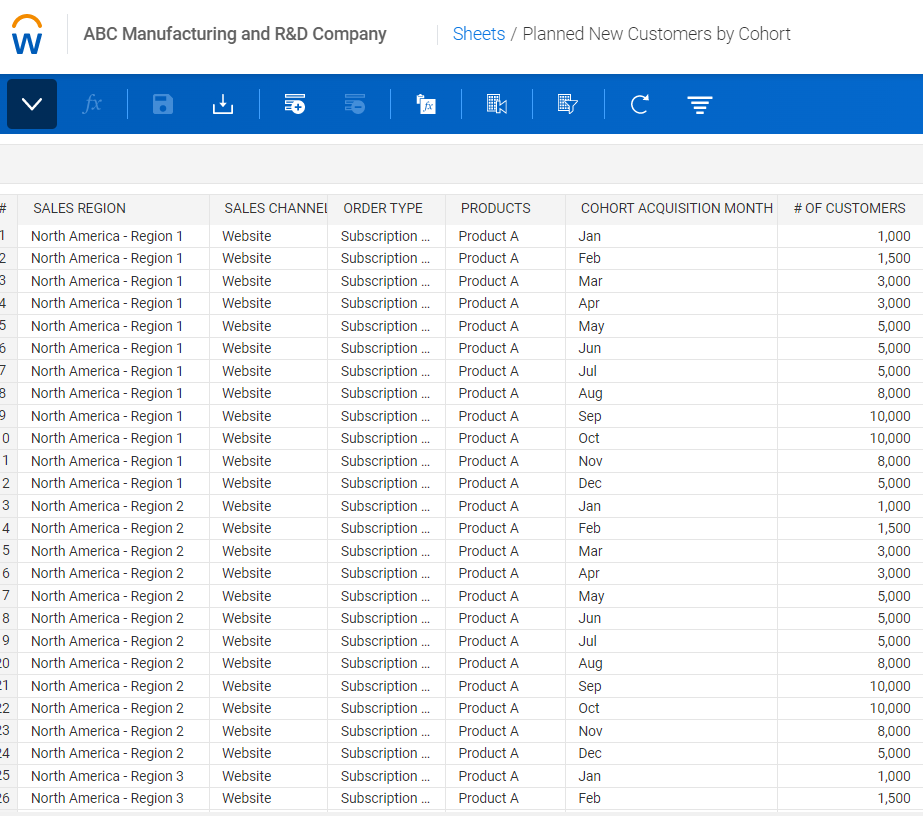
- 1. Planned # of Customers/Cohort
- Modeled sheet
- Create number data entry column to input number of customers
- Create calculated account and link the data entry column
- Input by cohort dimension – this can be by month/period, type of cohort, etc (ex. Jan, Feb, Mar – the month new customers are acquired)
- No timespan
- 2. Cohort Drivers/Curves
- Modeled sheet
- Create number data entry columns, display as % (ex. 12 columns representing 12 months of the year) – this is where to input cascading percentages (aka curve)
- Create calculated accounts for each data entry column and link
- No timespan

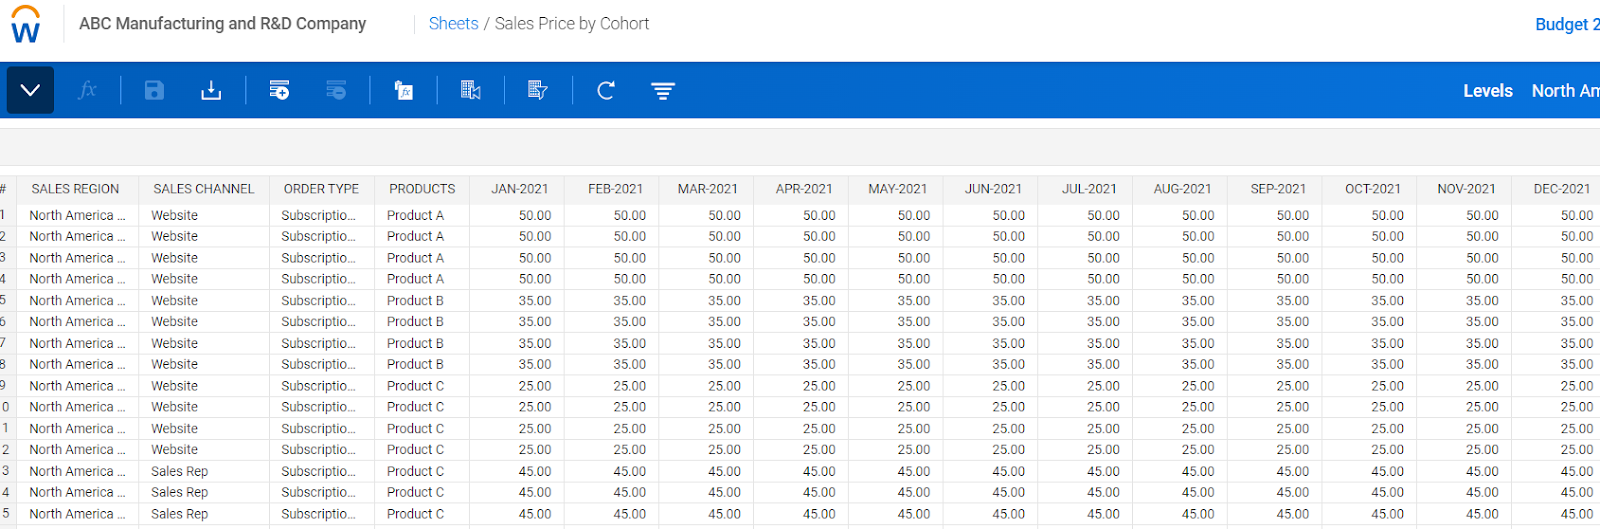
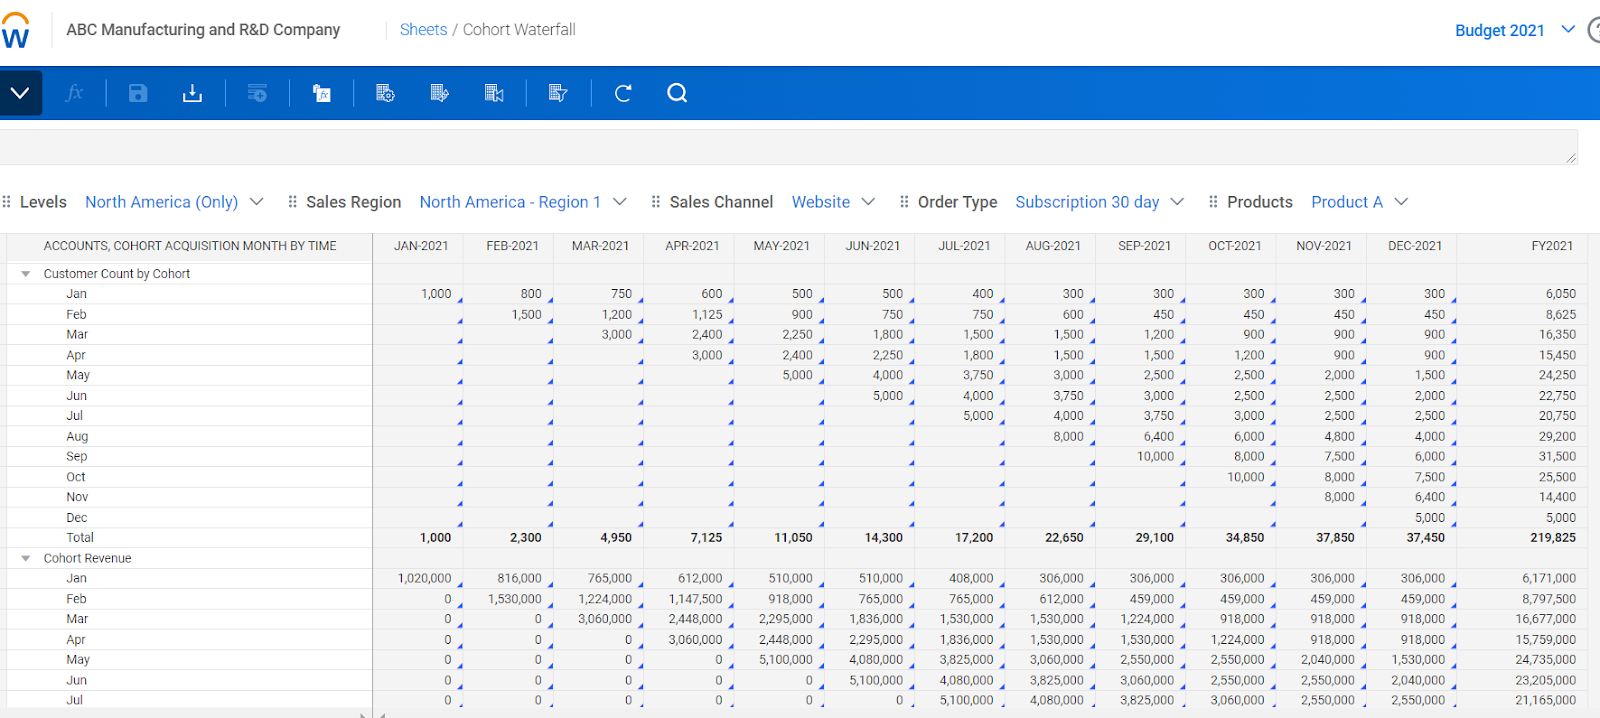
- 3. Revenue per product/customer by month
- Modeled Sheet
- With timespan
- With timespan
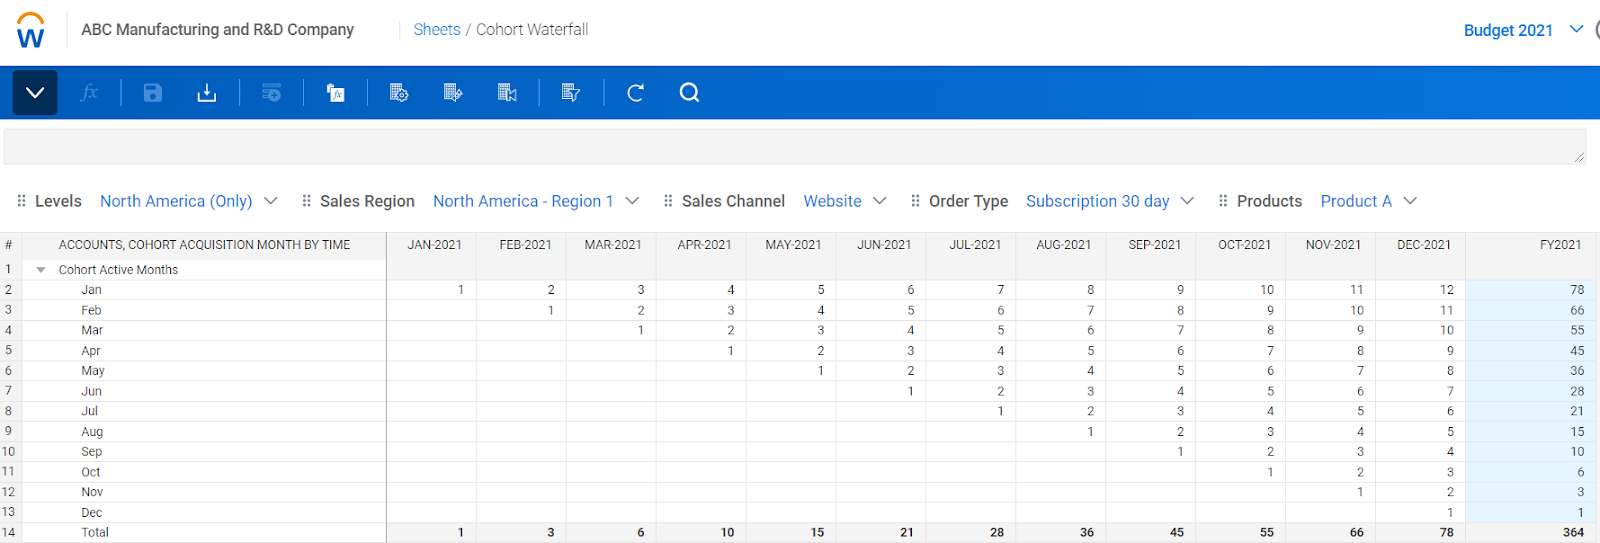
- 4. Cohort Waterfall
- Cube sheet
- Create standard account as a trigger – in this case using active month designation
- The active month designation to trigger what month the cohort waterfall calculates for each acquisition month
- Create calculated account with formula using iff and switch (this serves as an index match)
iff(isblank(ACCT.Cohort_Waterfall.Cohort_ActiveMonths),blank(),
iff(this.version.isactuals,blank(),
ACCT.NewCustomers_byCohort.No_Customers[Sales Region=this, Sales Channel=this, Order Type=this, Products=this, Cohort Acquisition Month=this]
*
switch(ACCT.Cohort_Waterfall.Cohort_ActiveMonths,
1,ACCT.Cohort_Drivers.M1[Sales Region=this, Sales Channel=this, Order Type=this, Products=this],
2,ACCT.Cohort_Drivers.M2[Sales Region=this, Sales Channel=this, Order Type=this, Products=this],
3,ACCT.Cohort_Drivers.M3[Sales Region=this, Sales Channel=this, Order Type=this, Products=this],
4,ACCT.Cohort_Drivers.M4[Sales Region=this, Sales Channel=this, Order Type=this, Products=this],
5,ACCT.Cohort_Drivers.M5[Sales Region=this, Sales Channel=this, Order Type=this, Products=this],
6,ACCT.Cohort_Drivers.M6[Sales Region=this, Sales Channel=this, Order Type=this, Products=this],
7,ACCT.Cohort_Drivers.M7[Sales Region=this, Sales Channel=this, Order Type=this, Products=this],
8,ACCT.Cohort_Drivers.M8[Sales Region=this, Sales Channel=this, Order Type=this, Products=this],
9,ACCT.Cohort_Drivers.M9[Sales Region=this, Sales Channel=this, Order Type=this, Products=this],
10,ACCT.Cohort_Drivers.M10[Sales Region=this, Sales Channel=this, Order Type=this, Products=this],
11,ACCT.Cohort_Drivers.M11[Sales Region=this, Sales Channel=this, Order Type=this, Products=this],
12,ACCT.Cohort_Drivers.M12[Sales Region=this, Sales Channel=this, Order Type=this, Products=this],
0)))
Cohort modeling is a powerful feature in Workday Adaptive Planning. Try it out and see what insights you can discover.
Visit Revelwood’s Knowledge Center for our Workday Adaptive Planning Tips & Tricks or sign up here to get our Workday Adaptive Planning Tips & Tricks delivered directly to your inbox. Not sure where to start with Workday Adaptive Planning? Our team here at Revelwood can help! Contact us info@revelwood.com for more information.
Read more Workday Adaptive Planning Tips & Tricks:
Workday Adaptive Planning Tips & Tricks: Check Boxes in Modeled Sheets
Workday Adaptive Planning Tips & Tricks: Excel Reporting Using a Report Template
Workday Adaptive Planning Tips & Tricks: Expand/Collapse Feature in OfficeConnect