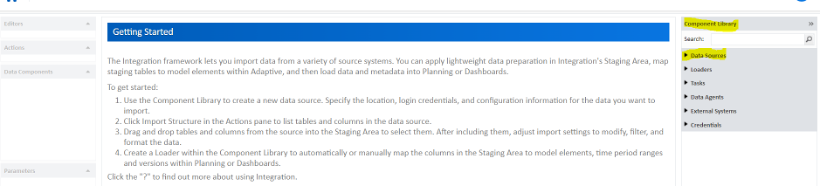
Did you know you can create an Excel file spreadsheet data source for Workday Adaptive Planning?
Watch Dave Miersch, Revelwood’s Practice Leader for Workday Adaptive Planning, demonstrate how to create and use an Excel file as a data source for Adaptive Planning. Dave shows you how to:
- Use any data source, such as from an ERP system or data warehouse
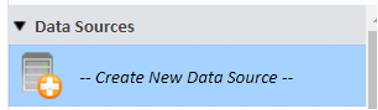
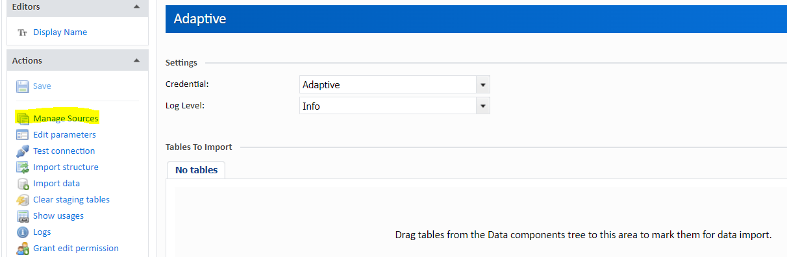
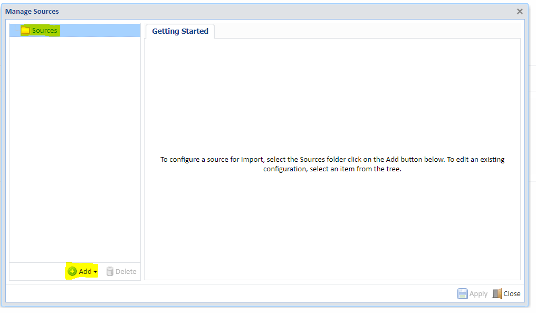
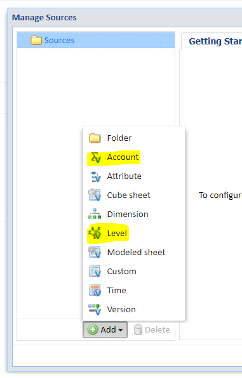
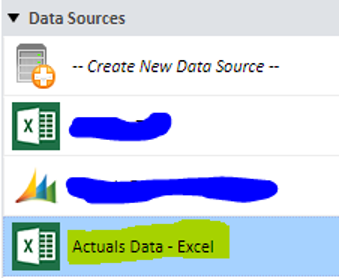
- Create a new data source
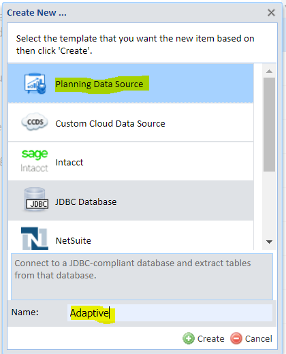
- Find and select the spreadsheet option
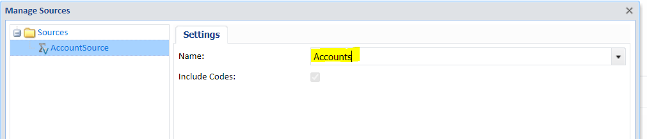
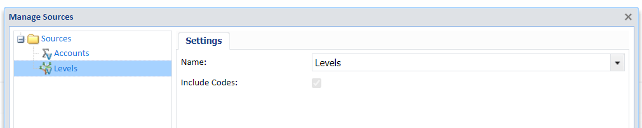
- Name the data source
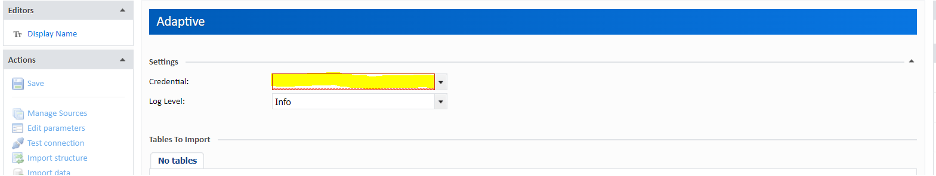
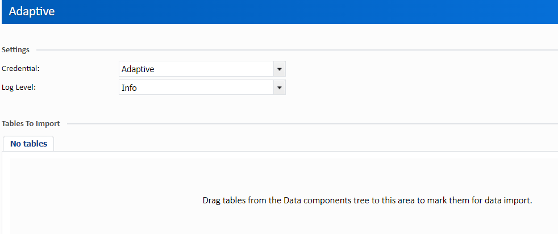
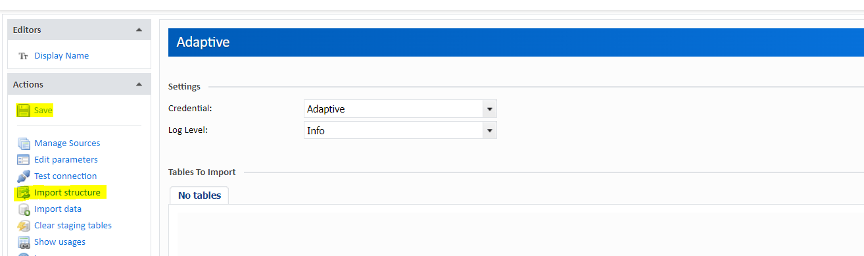
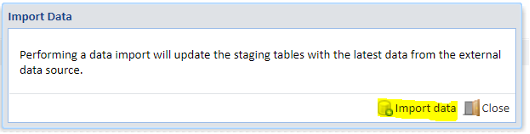
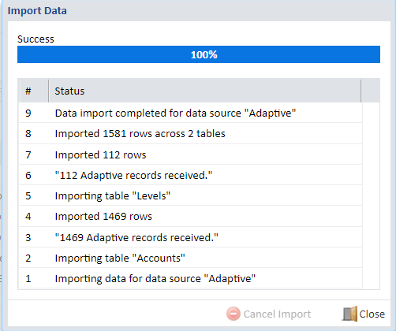
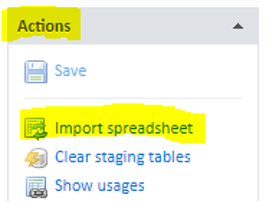
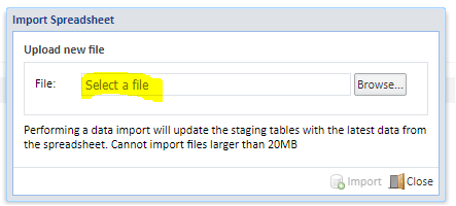
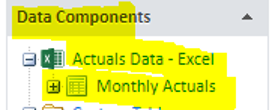
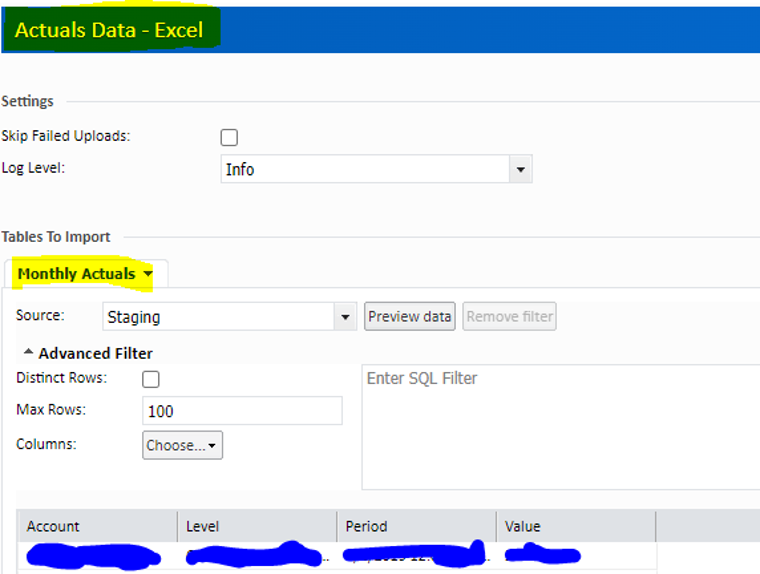
- Import the spreadsheet
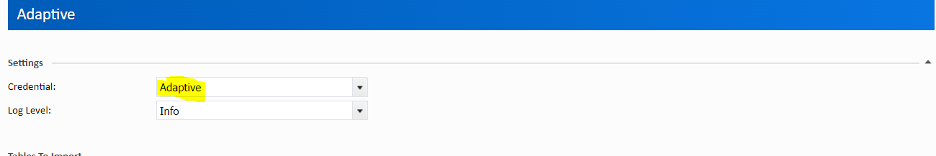
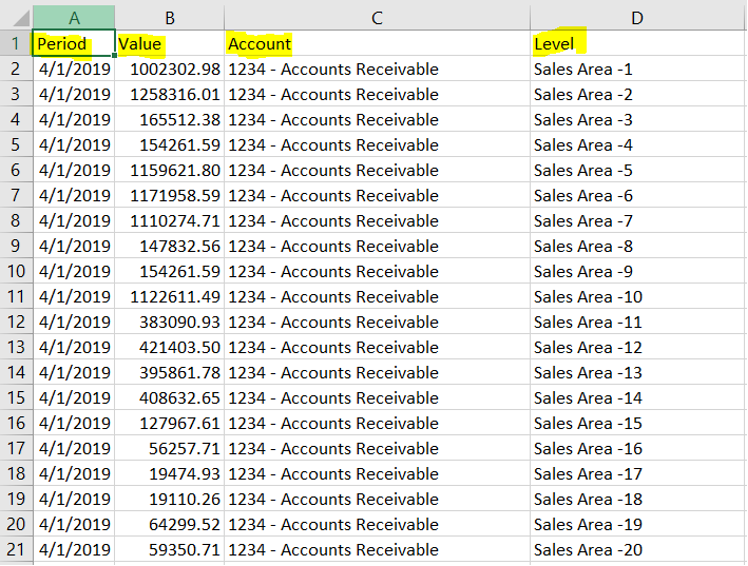
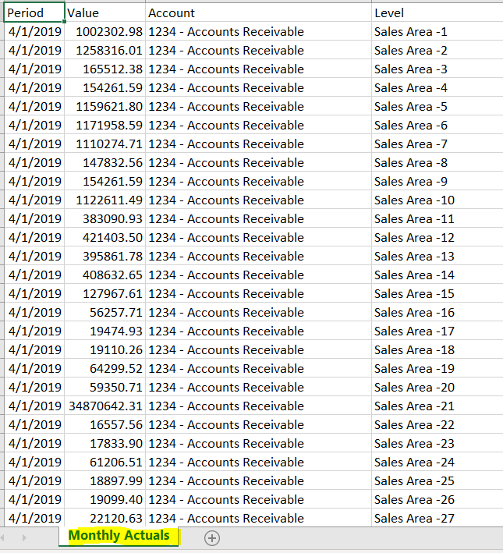
Adaptive Planning makes it very easy to import and export an Excel spreadsheet!
Read more Workday Adaptive Planning Tips & Tricks:
Workday Adaptive Planning Tips & Tricks: Data Integration and the Planning Data Source
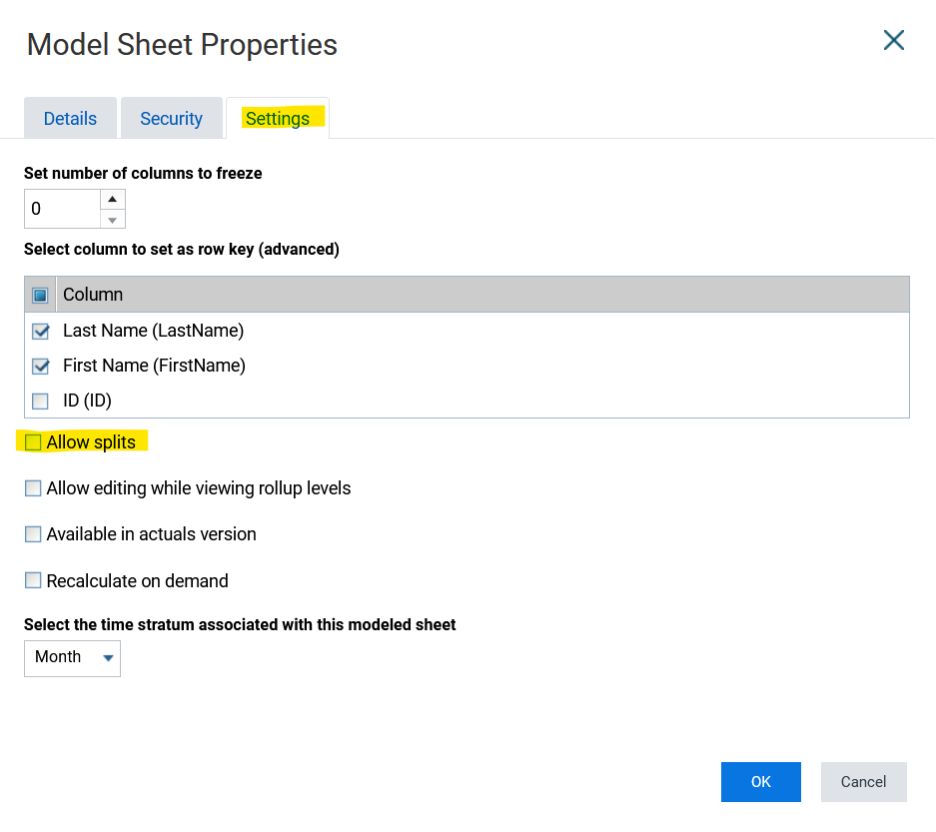
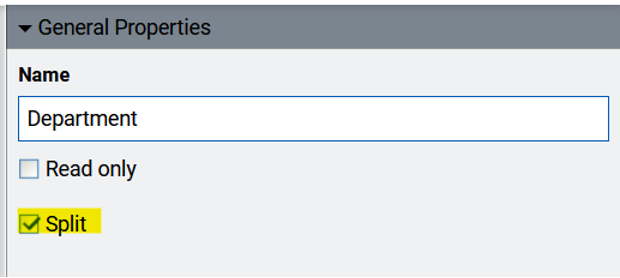
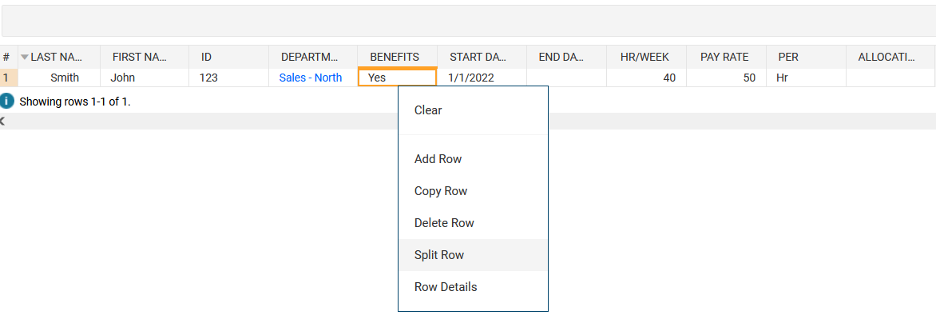
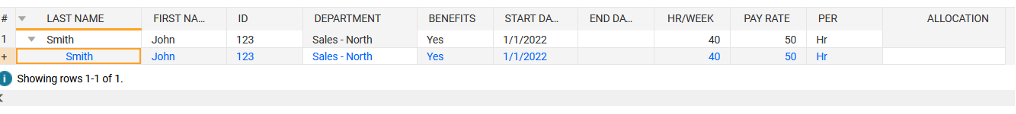
Workday Adaptive Planning Tips & Tricks: Utilizing Split Rows in Modeled Sheets
Workday Adaptive Planning Tips & Tricks: Data Integration and the Excel Spreadsheet Data Source