As of version 58 of IBM Planning Analytics Workspace (PAW), IBM introduced new features called Applications and Plans. These are meant to guide business processes by centralizing and organizing required tasks to make sure that all steps are completed in the correct sequence.
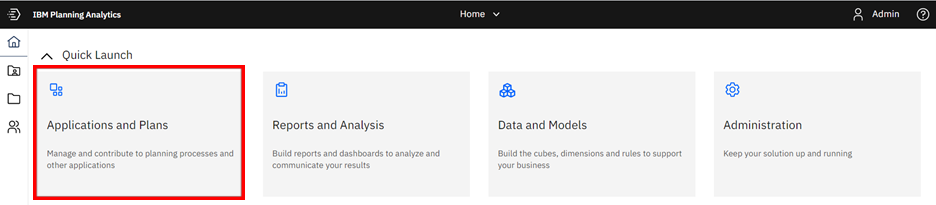
To access the area, click on the Applications and Plans pane on the homepage when you first log onto PAW.
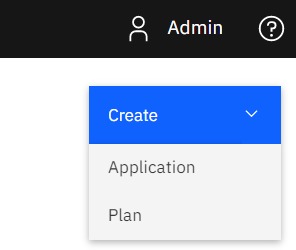
On the next page, you can create a new application or plan by clicking on the “Create” drop down and selecting the appropriate option.
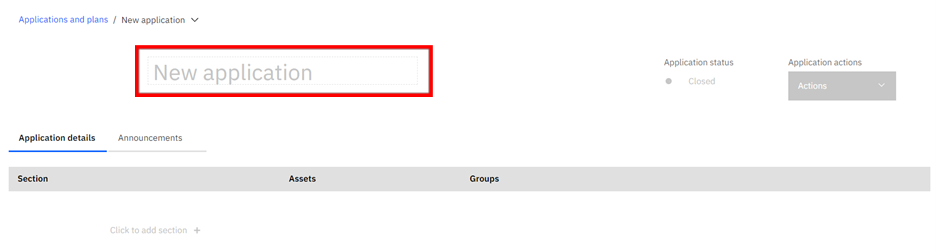
Before you can add to your application or plan, you must enter a name.
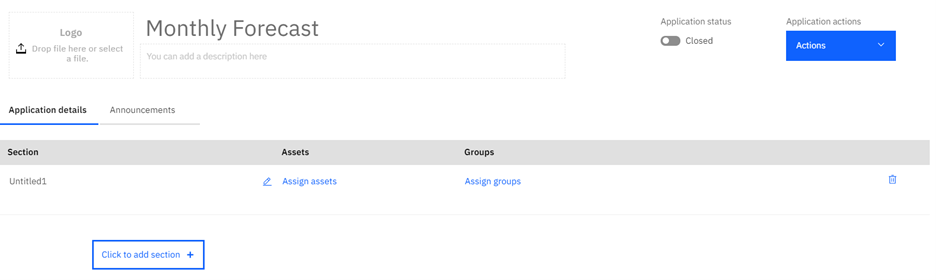
For applications, you can add “sections” to your process. Each section corresponds to a step in your business process. You can add assets such as PAW views, websheets, or books for users to access easily. You can also assign PAW groups to each step to show who is responsible for completing that task.
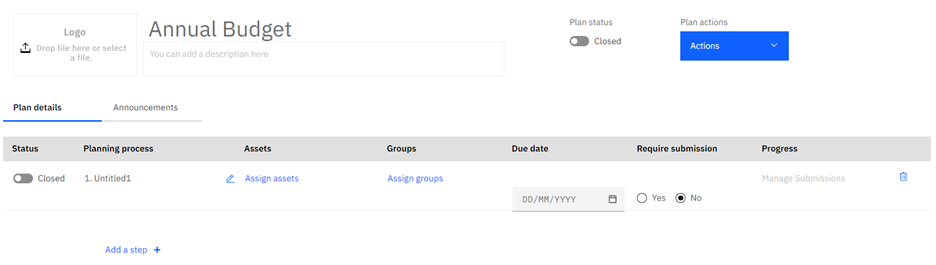
Plans are similar to applications, but they also provide the ability to set due dates and allow for submissions as a form of approval or completion notice.
So when would you use each type?
- Applications are designed to be used as a guide for set business processes that do not depend on multiple groups. Examples include CAR requests, monthly forecasting steps, cost center requests, or variance reviews.
- Plans are for collaboration in which the steps are dependent upon each other or other groups. This is typically the annual budget process and special projects such as mergers and acquisitions which require steps to be completed in a timely manner.
IBM Planning Analytics, which TM1 is the engine for, is full of new features and functionality. Not sure where to start? Our team here at Revelwood can help. Contact us for more information at info@revelwood.com. And stay tuned for more Planning Analytics Tips & Tricks weekly in our Knowledge Center and in upcoming newsletters!
Read more IBM Planning Analytics Tips & Tricks:
IBM Planning Analytics Tips & Tricks: Creating Groups in PAW