User experience is an important factor when designing any system. One of the most important aspects of the experience is the ease in which users can navigate from one page to another.
In situations where an IBM Planning Analytics Workspace (PAW) book has multiple sheets, the navigation is as easy as clicking on the applicable sheet at the top of the page (just like you would do in Excel). However, in situations where there are multiple books, the navigation may require the use of a button.
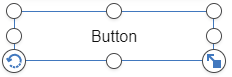
Buttons are easy to create via the icon at the top of the screen.

The resulting button appears as a rectangle and can be formatted to change things such as the text, the color and the border.
But did you know that you can make your own button by merging an image with a button? For example, maybe you want a “home” button that looks like a house. You can do this by using an image from the shapes icon and formatting it to your desired color and size.

You can then drag a button on top of the image.
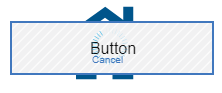
By changing the text to a blank value, the button becomes “invisible.” Users will then be able to click on the house to navigate back to the home page.
This approach offers an easy way to create an good user experience for navigation throughout your PAW books.
IBM Planning Analytics, which TM1 is the engine for, is full of new features and functionality. Not sure where to start? Our team here at Revelwood can help. Contact us for more information at info@revelwood.com. And stay tuned for more Planning Analytics Tips & Tricks weekly in our Knowledge Center and in upcoming newsletters!
Read more IBM Planning Analytics Tips & Tricks:
IBM Planning Analytics Tips & Tricks: Create New Books with the Diamond Icon
IBM Planning Analytics Tips & Tricks: Using Words and Numbers Together