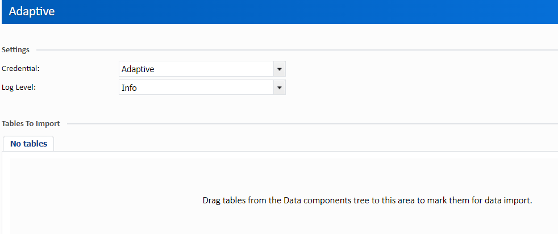
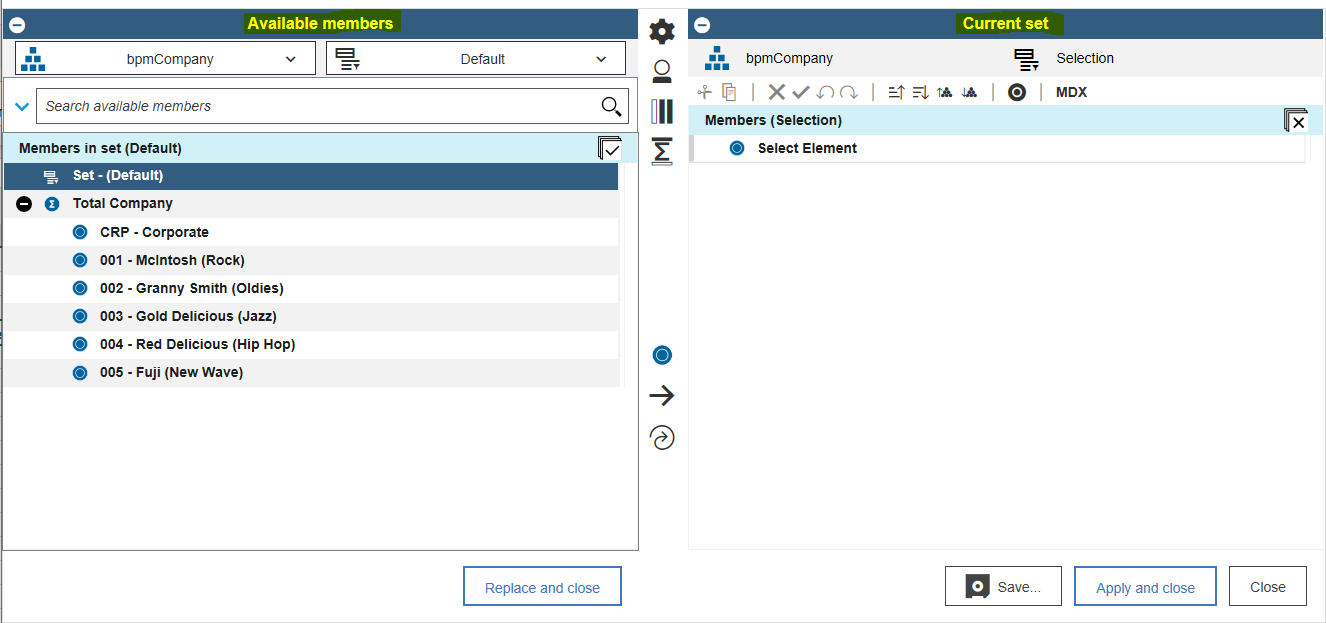
The IBM Planning Analytics Set Editor is the equivalent to the TM1 Subset Editor for Architect and Perspectives, but with expanded functionality. Getting started with the set editor is as simple as double clicking on a dimension within your exploration.
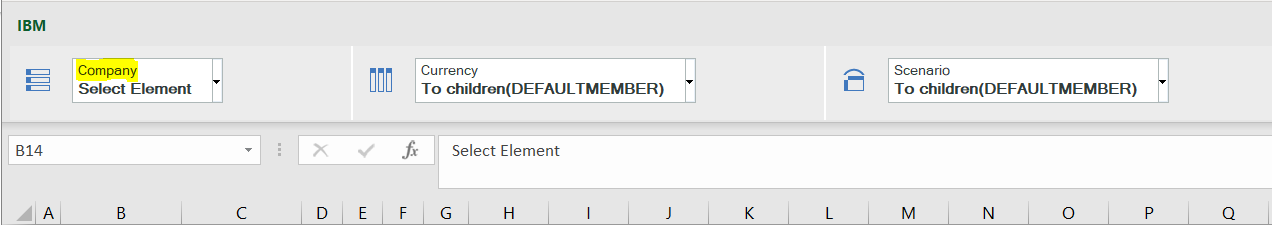
In this example, I double clicked on the Company dimension. Right away you can see that it is organized via a left and right pane where the left side represents what is available within the dimension and the right side shows what is currently selected, or the current set.
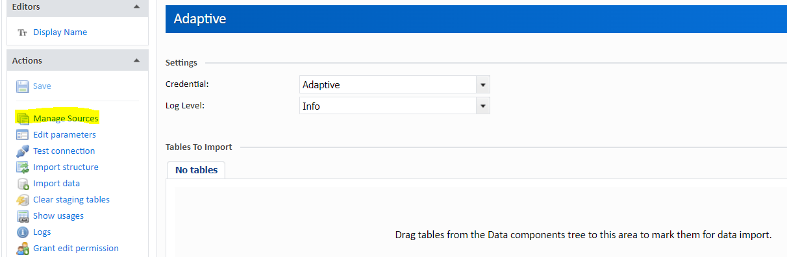
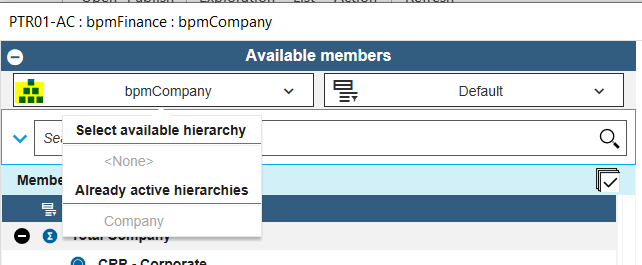
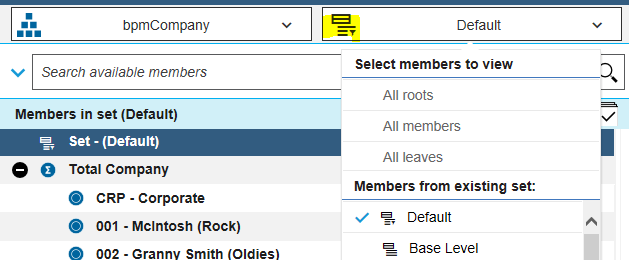
The left side now contains two drop downs: one for hierarchies and one for members. The members selection allows you to choose a series of pre-built categories along with existing subsets.
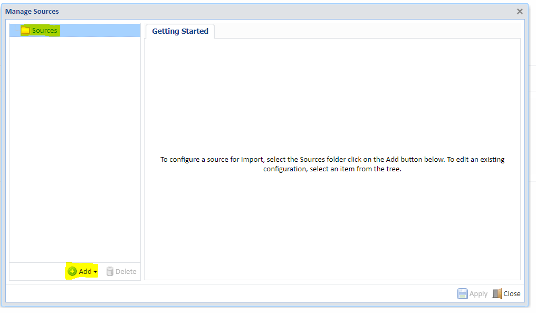
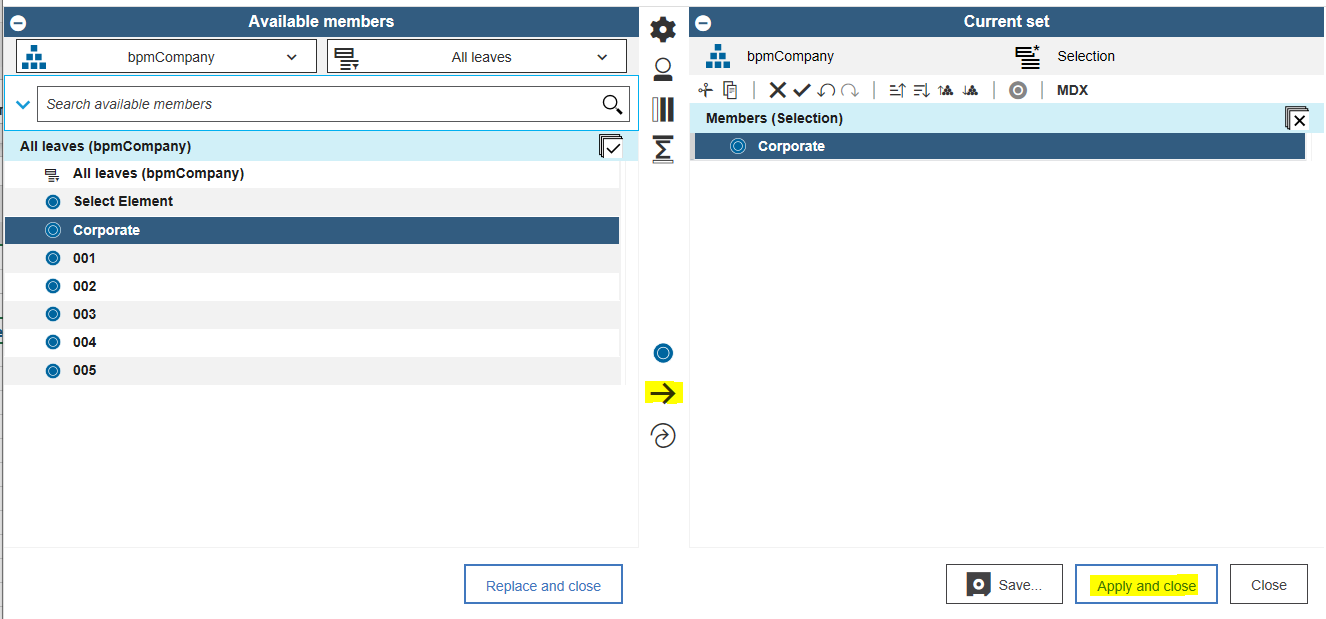
After selecting the members to be inserted into the current set, you can place them into the right side’s Current Set by simply clicking on the Insert button between the panes. Click the “Apply and close” button your newly selected member(s) will show within your exploration.
Read more IBM Planning Analytics Tips & Tricks:
IBM Planning Analytics Tips & Tricks: Shortcuts in PAW Models
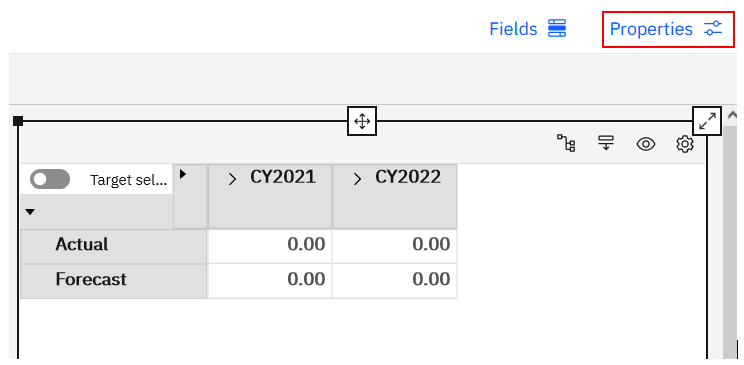
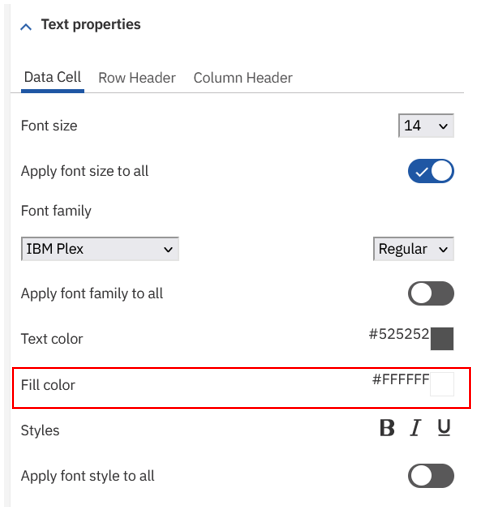
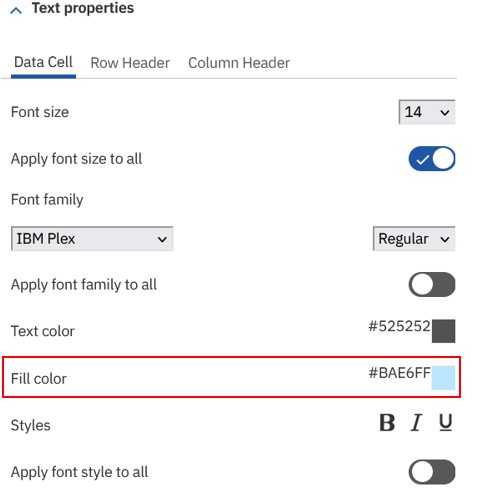
IBM Planning Analytics Tips & Tricks: Customizing Background Colors for Data and Header Cells