Did you know that dimensions exist within IBM Planning Analytics that display your model’s public subsets?
A dimension called }Subsets_<Dimension Name> is automatically created when a dimension is created. The elements of this new dimension are dynamically updated as permanent public subsets are created and destroyed (note: the creation of temporary subsets does not update this dimension).
These control dimensions allow for easy access to public subsets within TurboIntegrator processes. In addition, the subset control dimensions can be accessed via Architect and Planning Analytics for Excel (PAx).
To access subset control dimensions via Architect:
- Make sure “Display Control Objects” is enabled
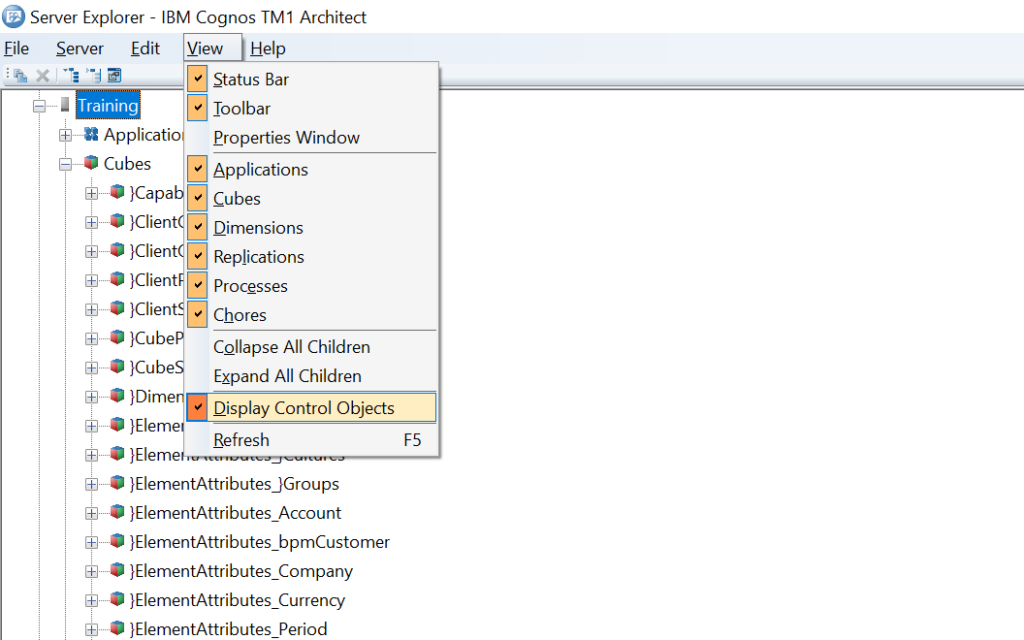
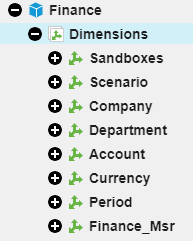
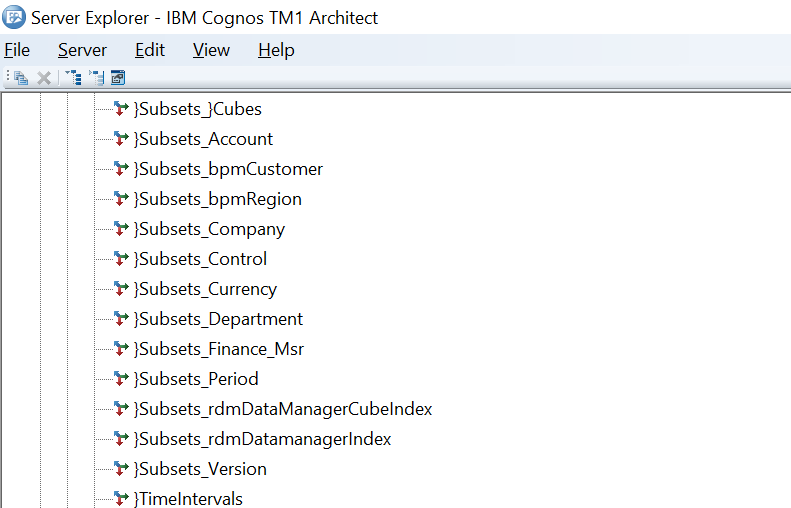
2. Navigate to “Dimensions” and scroll down until you reach “}Subsets_<Dimension Name>”
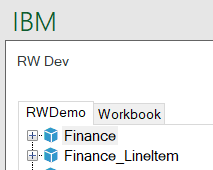
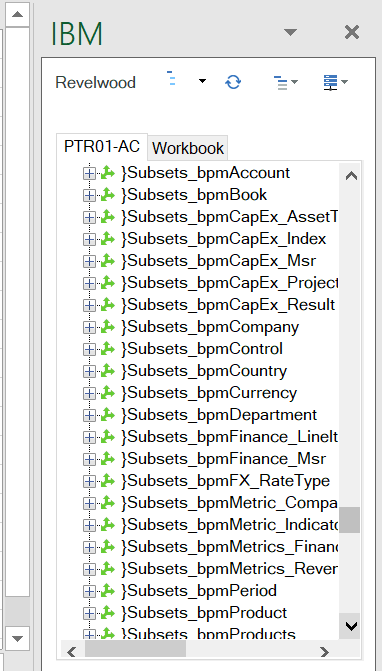
To access via Planning Analytics for Excel:
- On the task pane, make sure “Show Control Objects” and “Show Dimensions” are both enabled
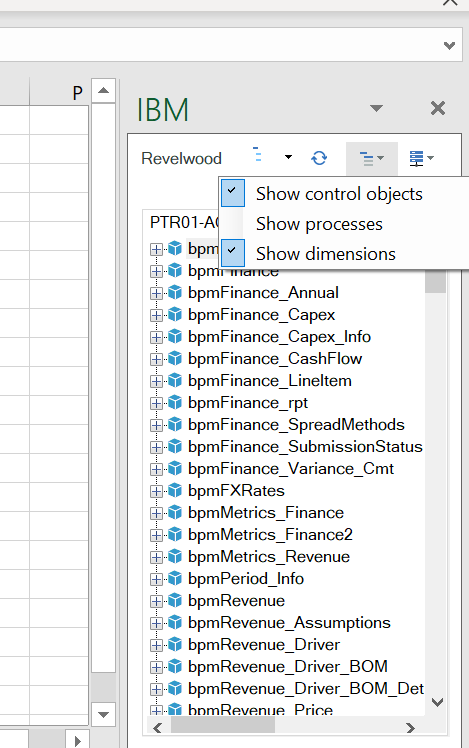
2. Navigate to “Dimensions” and scroll down until you reach “}Subsets_<Dimension Name>”
This feature gives you an easy approach to see (and loop through) your public subsets without having to create scripts that reference Windows folders.
IBM Planning Analytics, which TM1 is the engine for, is full of new features and functionality. Not sure where to start? Our team here at Revelwood can help. Contact us for more information at info@revelwood.com. And stay tuned for more Planning Analytics Tips & Tricks weekly in our Knowledge Center and in upcoming newsletters!
Read more IBM Planning Analytics Tips & Tricks:
IBM Planning Analytics Tips & Tricks: Maintaining Subset Driven Consolidations
IBM Planning Analytics Tips & Tricks: Compatibility of Views and Subsets