Have you ever wanted to filter a list of data to look at a subset of the entire table? Many of you know that you can use the filter button within Excel’s data section to do this.

But what if you wanted to create a filter that users can change without having to navigate through ribbons? Did you know that you can do this using Excel’s FILTER function?
The FILTER function allows you to filter a range of data based on criteria you define. This allows you to create selector cells which can be used within a formula to filter the selected data. The function is written as follows:
FILTER (range, formula for inclusion, if empty)
- The range consists of the entire table to be checked
- The formula for inclusion consists of criteria to be filtered
- The last parameter (optional) defines a value to be returned when no results are found
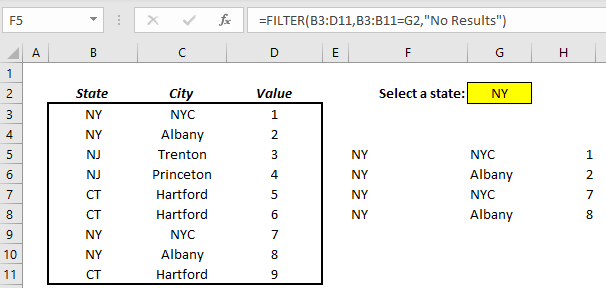
The example below shows a table on the left, an input cell, and the FILTER command in cell F5. In this case, the function is being used to look at the entire table (cells B3 through D11) and checking to see if the value in column B is the same as the value in cell G2.
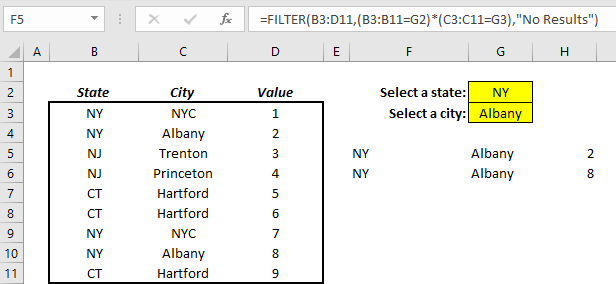
The formula for inclusion can use more complex approaches to check multiple values. This is done by using the multiplication operator as the “and” statement. The example below expands upon the first example by allowing the user to independently select both a state and a city.
This functionality allows you to replicate Planning Analytics selector concepts into an existing spreadsheet.
IBM Planning Analytics, which TM1 is the engine for, is full of new features and functionality. Not sure where to start? Our team here at Revelwood can help. Contact us for more information at info@revelwood.com. And stay tuned for more Planning Analytics Tips & Tricks weekly in our Knowledge Center and in upcoming newsletters!
Read more IBM Planning Analytics Tips & Tricks:
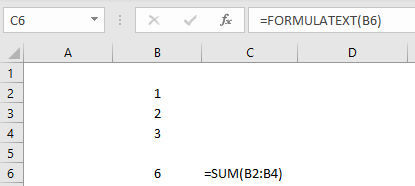
IBM Planning Analytics Tips & Tricks: The Excel FORMULATEXT Function
IBM Planning Analytics Tips & Tricks: Learn the Excel CELL Formula
IBM Planning Analytics Tips & Tricks: New Excel Feature – Map Charts