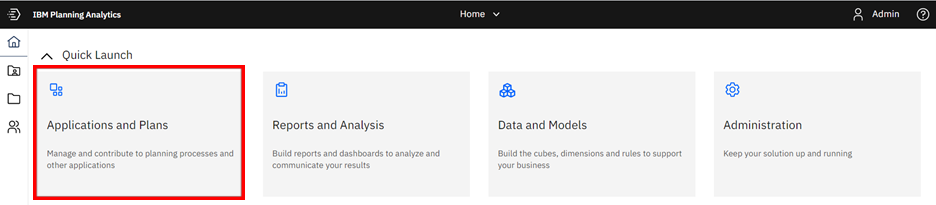
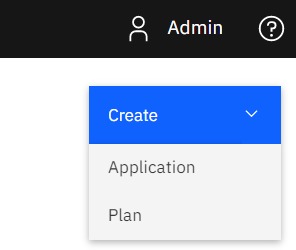
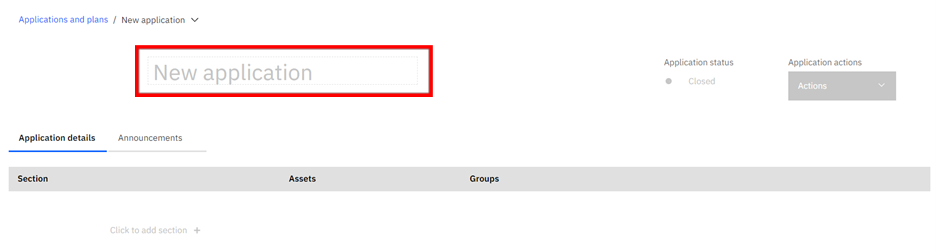
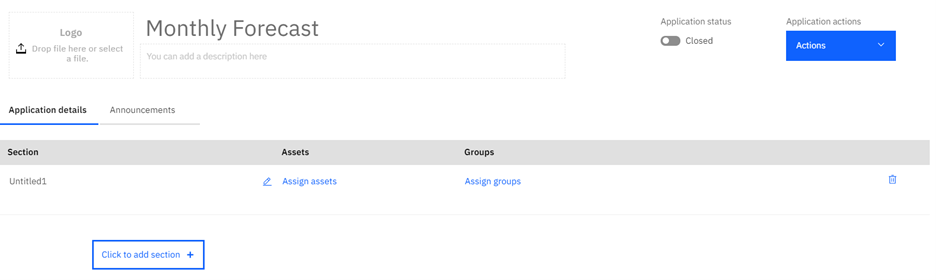
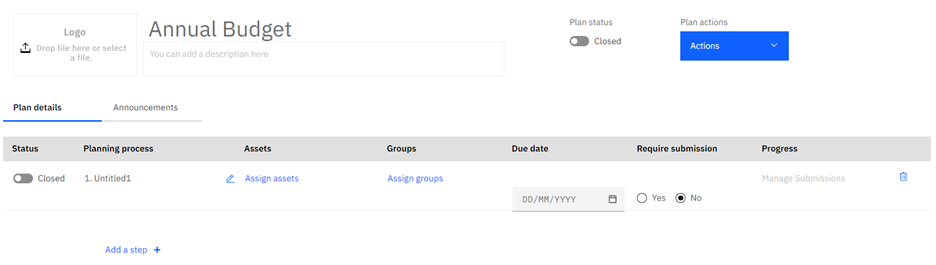
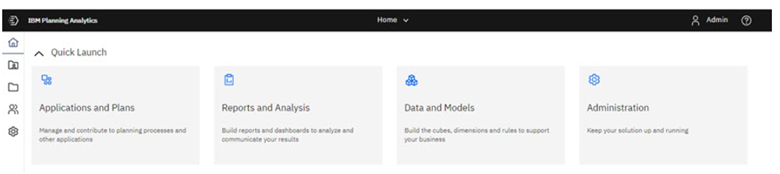
IBM Planning Analytics version 57 introduced applications and plans which let you organize Planning Analytics Workspace (PAW) assets such as books, view, and websheets into groups. These approaches allow you to group items together in sections (similar to a folder) or in steps (similar to a planning process). It is easy to create an Application or Plan in PAW, but there may be situations where you want to change the type by converting an existing Application to a Plan or vice versa.
To convert an existing Application or Plan, open the object so you can make edits. Then click on the Actions menu and select “Save as.”
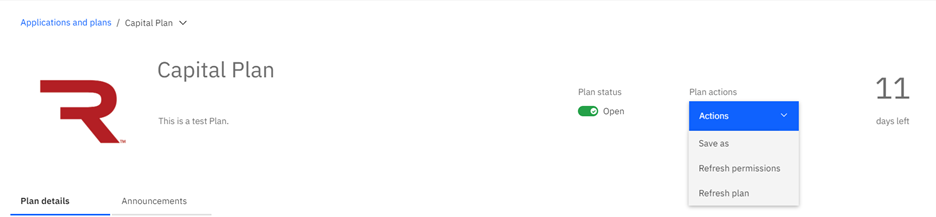
The window that appears will allow you to rename the object as well as select the type to save it as.

This will create another copy of the object. Your original Application or Plan will remain as is.
This feature will allow you to change your PAW organization approach as your requirements and process approach changes.
IBM Planning Analytics, powered by TM1, is full of new features and functionality. Not sure where to start? Our team here at Revelwood can help. Contact us for more information at info@revelwood.com. And stay tuned for more Planning Analytics Tips & Tricks weekly in our Knowledge Center and in upcoming newsletters!
Read more IBM Planning Analytics Tips & Tricks:
IBM Planning Analytics Tips & Tricks: Introduction to Apps and Plans
IBM Planning Analytics Tips & Tricks: Creating Groups in PAW